Stock Analysis
- Switzerland
- /
- Electric Utilities
- /
- SWX:EDHN
Energiedienst Holding's (VTX:EDHN) underlying earnings growth outpaced the favorable return generated for shareholders over the past five years

When we invest, we're generally looking for stocks that outperform the market average. And in our experience, buying the right stocks can give your wealth a significant boost. For example, the Energiedienst Holding AG (VTX:EDHN) share price is up 22% in the last 5 years, clearly besting the market return of around 14% (ignoring dividends).
Since the long term performance has been good but there's been a recent pullback of 4.1%, let's check if the fundamentals match the share price.
See our latest analysis for Energiedienst Holding
There is no denying that markets are sometimes efficient, but prices do not always reflect underlying business performance. One imperfect but simple way to consider how the market perception of a company has shifted is to compare the change in the earnings per share (EPS) with the share price movement.
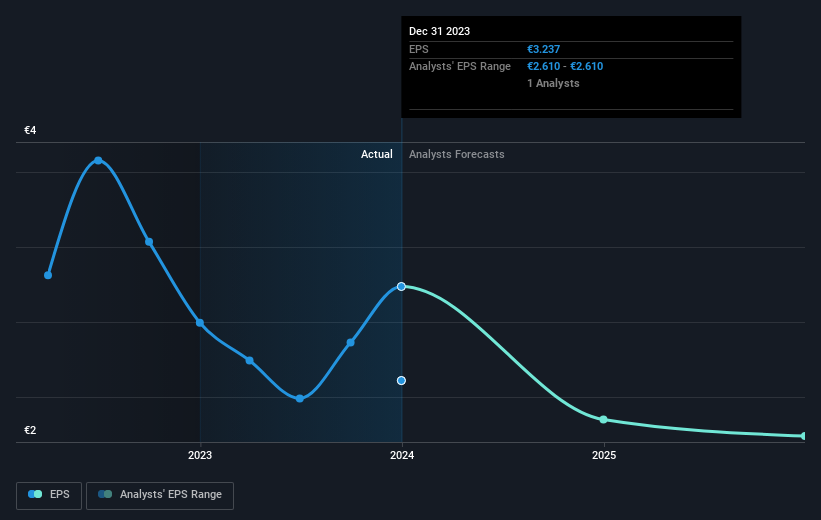
During five years of share price growth, Energiedienst Holding achieved compound earnings per share (EPS) growth of 50% per year. The EPS growth is more impressive than the yearly share price gain of 4% over the same period. Therefore, it seems the market has become relatively pessimistic about the company. This cautious sentiment is reflected in its (fairly low) P/E ratio of 11.93.
You can see how EPS has changed over time in the image below (click on the chart to see the exact values).
We know that Energiedienst Holding has improved its bottom line over the last three years, but what does the future have in store? This free interactive report on Energiedienst Holding's balance sheet strength is a great place to start, if you want to investigate the stock further.
What About Dividends?
As well as measuring the share price return, investors should also consider the total shareholder return (TSR). The TSR incorporates the value of any spin-offs or discounted capital raisings, along with any dividends, based on the assumption that the dividends are reinvested. It's fair to say that the TSR gives a more complete picture for stocks that pay a dividend. In the case of Energiedienst Holding, it has a TSR of 33% for the last 5 years. That exceeds its share price return that we previously mentioned. And there's no prize for guessing that the dividend payments largely explain the divergence!
A Different Perspective
Energiedienst Holding shareholders are down 13% for the year (even including dividends), but the market itself is up 1.6%. Even the share prices of good stocks drop sometimes, but we want to see improvements in the fundamental metrics of a business, before getting too interested. On the bright side, long term shareholders have made money, with a gain of 6% per year over half a decade. It could be that the recent sell-off is an opportunity, so it may be worth checking the fundamental data for signs of a long term growth trend. It's always interesting to track share price performance over the longer term. But to understand Energiedienst Holding better, we need to consider many other factors. Even so, be aware that Energiedienst Holding is showing 2 warning signs in our investment analysis , and 1 of those shouldn't be ignored...
But note: Energiedienst Holding may not be the best stock to buy. So take a peek at this free list of interesting companies with past earnings growth (and further growth forecast).
Please note, the market returns quoted in this article reflect the market weighted average returns of stocks that currently trade on Swiss exchanges.
Valuation is complex, but we're helping make it simple.
Find out whether Energiedienst Holding is potentially over or undervalued by checking out our comprehensive analysis, which includes fair value estimates, risks and warnings, dividends, insider transactions and financial health.
View the Free AnalysisHave feedback on this article? Concerned about the content? Get in touch with us directly. Alternatively, email editorial-team (at) simplywallst.com.
This article by Simply Wall St is general in nature. We provide commentary based on historical data and analyst forecasts only using an unbiased methodology and our articles are not intended to be financial advice. It does not constitute a recommendation to buy or sell any stock, and does not take account of your objectives, or your financial situation. We aim to bring you long-term focused analysis driven by fundamental data. Note that our analysis may not factor in the latest price-sensitive company announcements or qualitative material. Simply Wall St has no position in any stocks mentioned.

Simply Wall St
About SWX:EDHN
Energiedienst Holding
Energiedienst Holding AG, together with its subsidiaries, engages in the production, distribution, and sale of electricity under NatureEnergie brand in Switzerland.
Excellent balance sheet with acceptable track record.
