Stock Analysis
Despite delivering investors losses of 2.3% over the past 5 years, Faes Farma (BME:FAE) has been growing its earnings


Ideally, your overall portfolio should beat the market average. But even the best stock picker will only win with some selections. So we wouldn't blame long term Faes Farma, S.A. (BME:FAE) shareholders for doubting their decision to hold, with the stock down 18% over a half decade. On the other hand the share price has bounced 8.1% over the last week.
Although the past week has been more reassuring for shareholders, they're still in the red over the last five years, so let's see if the underlying business has been responsible for the decline.
See our latest analysis for Faes Farma
In his essay The Superinvestors of Graham-and-Doddsville Warren Buffett described how share prices do not always rationally reflect the value of a business. One way to examine how market sentiment has changed over time is to look at the interaction between a company's share price and its earnings per share (EPS).
During the unfortunate half decade during which the share price slipped, Faes Farma actually saw its earnings per share (EPS) improve by 8.8% per year. Given the share price reaction, one might suspect that EPS is not a good guide to the business performance during the period (perhaps due to a one-off loss or gain). Or possibly, the market was previously very optimistic, so the stock has disappointed, despite improving EPS.
Generally speaking we'd hope to see stronger share price increases on the back of sustained EPS growth, but other metrics may hold a clue to why the share price performance is relatively modest.
The steady dividend doesn't really explain why the share price is down. While it's not completely obvious why the share price is down, a closer look at the company's history might help explain it.
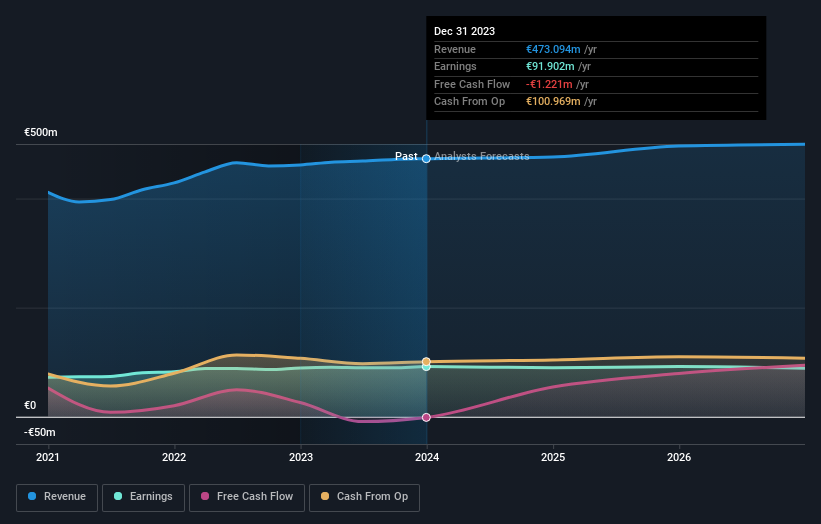
The company's revenue and earnings (over time) are depicted in the image below (click to see the exact numbers).
Balance sheet strength is crucial. It might be well worthwhile taking a look at our free report on how its financial position has changed over time.
What About Dividends?
As well as measuring the share price return, investors should also consider the total shareholder return (TSR). The TSR is a return calculation that accounts for the value of cash dividends (assuming that any dividend received was reinvested) and the calculated value of any discounted capital raisings and spin-offs. It's fair to say that the TSR gives a more complete picture for stocks that pay a dividend. In the case of Faes Farma, it has a TSR of -2.3% for the last 5 years. That exceeds its share price return that we previously mentioned. And there's no prize for guessing that the dividend payments largely explain the divergence!
A Different Perspective
Faes Farma shareholders gained a total return of 5.7% during the year. Unfortunately this falls short of the market return. On the bright side, that's still a gain, and it is certainly better than the yearly loss of about 0.5% endured over half a decade. It could well be that the business is stabilizing. It's always interesting to track share price performance over the longer term. But to understand Faes Farma better, we need to consider many other factors. Consider for instance, the ever-present spectre of investment risk. We've identified 2 warning signs with Faes Farma (at least 1 which is significant) , and understanding them should be part of your investment process.
If you like to buy stocks alongside management, then you might just love this free list of companies. (Hint: insiders have been buying them).
Please note, the market returns quoted in this article reflect the market weighted average returns of stocks that currently trade on Spanish exchanges.
Valuation is complex, but we're helping make it simple.
Find out whether Faes Farma is potentially over or undervalued by checking out our comprehensive analysis, which includes fair value estimates, risks and warnings, dividends, insider transactions and financial health.
View the Free AnalysisHave feedback on this article? Concerned about the content? Get in touch with us directly. Alternatively, email editorial-team (at) simplywallst.com.
This article by Simply Wall St is general in nature. We provide commentary based on historical data and analyst forecasts only using an unbiased methodology and our articles are not intended to be financial advice. It does not constitute a recommendation to buy or sell any stock, and does not take account of your objectives, or your financial situation. We aim to bring you long-term focused analysis driven by fundamental data. Note that our analysis may not factor in the latest price-sensitive company announcements or qualitative material. Simply Wall St has no position in any stocks mentioned.
About BME:FAE
Faes Farma
Faes Farma, S.A., a pharmaceutical company, researches, develops, produces, and markets pharmaceutical products and raw materials in Spain and internationally.
Flawless balance sheet with proven track record.
