Stock Analysis
- South Korea
- /
- Semiconductors
- /
- KOSDAQ:A451220
Companies Like IMT (KOSDAQ:451220) Can Afford To Invest In Growth
We can readily understand why investors are attracted to unprofitable companies. For example, although Amazon.com made losses for many years after listing, if you had bought and held the shares since 1999, you would have made a fortune. But while history lauds those rare successes, those that fail are often forgotten; who remembers Pets.com?
So should IMT (KOSDAQ:451220) shareholders be worried about its cash burn? For the purposes of this article, cash burn is the annual rate at which an unprofitable company spends cash to fund its growth; its negative free cash flow. The first step is to compare its cash burn with its cash reserves, to give us its 'cash runway'.
See our latest analysis for IMT
How Long Is IMT's Cash Runway?
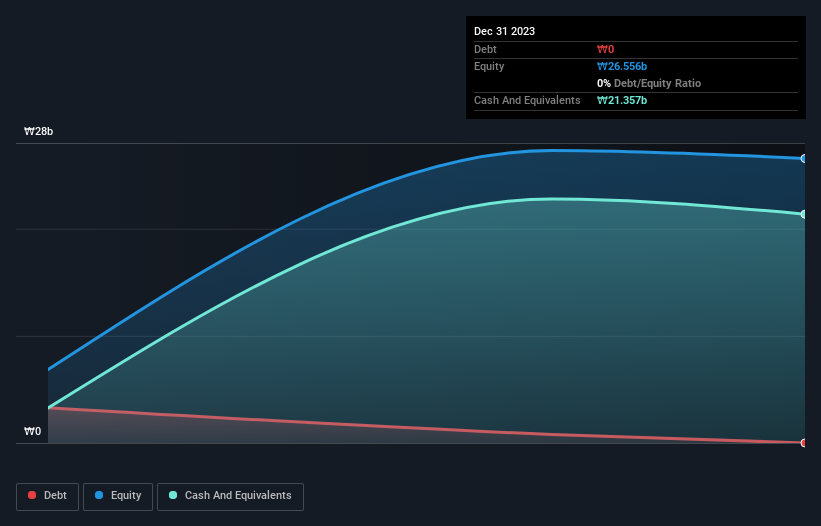
A company's cash runway is the amount of time it would take to burn through its cash reserves at its current cash burn rate. In December 2023, IMT had ₩21b in cash, and was debt-free. In the last year, its cash burn was ₩309m. That means it had a cash runway of very many years as of December 2023. While this is only one measure of its cash burn situation, it certainly gives us the impression that holders have nothing to worry about. Depicted below, you can see how its cash holdings have changed over time.
Is IMT's Revenue Growing?
We don't yet have enough data to look at the trend in IMT's cash burn, so operating revenue growth is arguably the best measure of growth we have, right now. Unfortunately, the last year has been a disappointment, with operating revenue dropping 34% during the period. In reality, this article only makes a short study of the company's growth data. This graph of historic earnings and revenue shows how IMT is building its business over time.
How Easily Can IMT Raise Cash?
Since its revenue growth is moving in the wrong direction, IMT shareholders may wish to think ahead to when the company may need to raise more cash. Issuing new shares, or taking on debt, are the most common ways for a listed company to raise more money for its business. Many companies end up issuing new shares to fund future growth. By looking at a company's cash burn relative to its market capitalisation, we gain insight on how much shareholders would be diluted if the company needed to raise enough cash to cover another year's cash burn.
IMT has a market capitalisation of ₩188b and burnt through ₩309m last year, which is 0.2% of the company's market value. That means it could easily issue a few shares to fund more growth, and might well be in a position to borrow cheaply.
How Risky Is IMT's Cash Burn Situation?
It may already be apparent to you that we're relatively comfortable with the way IMT is burning through its cash. For example, we think its cash runway suggests that the company is on a good path. While its falling revenue wasn't great, the other factors mentioned in this article more than make up for weakness on that measure. After taking into account the various metrics mentioned in this report, we're pretty comfortable with how the company is spending its cash, as it seems on track to meet its needs over the medium term. Taking a deeper dive, we've spotted 3 warning signs for IMT you should be aware of, and 1 of them doesn't sit too well with us.
Of course, you might find a fantastic investment by looking elsewhere. So take a peek at this free list of companies insiders are buying, and this list of stocks growth stocks (according to analyst forecasts)
Valuation is complex, but we're helping make it simple.
Find out whether IMT is potentially over or undervalued by checking out our comprehensive analysis, which includes fair value estimates, risks and warnings, dividends, insider transactions and financial health.
View the Free AnalysisHave feedback on this article? Concerned about the content? Get in touch with us directly. Alternatively, email editorial-team (at) simplywallst.com.
This article by Simply Wall St is general in nature. We provide commentary based on historical data and analyst forecasts only using an unbiased methodology and our articles are not intended to be financial advice. It does not constitute a recommendation to buy or sell any stock, and does not take account of your objectives, or your financial situation. We aim to bring you long-term focused analysis driven by fundamental data. Note that our analysis may not factor in the latest price-sensitive company announcements or qualitative material. Simply Wall St has no position in any stocks mentioned.

Simply Wall St
About KOSDAQ:A451220
IMT
IMT Co., Ltd. provides dry cleaning solutions primarily in South Korea.
Excellent balance sheet with weak fundamentals.
