Stock Analysis
cBrain's (CPH:CBRAIN) five-year total shareholder returns outpace the underlying earnings growth


It might be of some concern to shareholders to see the cBrain A/S (CPH:CBRAIN) share price down 13% in the last month. But that doesn't undermine the fantastic longer term performance (measured over five years). To be precise, the stock price is 781% higher than it was five years ago, a wonderful performance by any measure. Arguably, the recent fall is to be expected after such a strong rise. But the real question is whether the business fundamentals can improve over the long term. It really delights us to see such great share price performance for investors.
While the stock has fallen 6.8% this week, it's worth focusing on the longer term and seeing if the stocks historical returns have been driven by the underlying fundamentals.
See our latest analysis for cBrain
While markets are a powerful pricing mechanism, share prices reflect investor sentiment, not just underlying business performance. One way to examine how market sentiment has changed over time is to look at the interaction between a company's share price and its earnings per share (EPS).
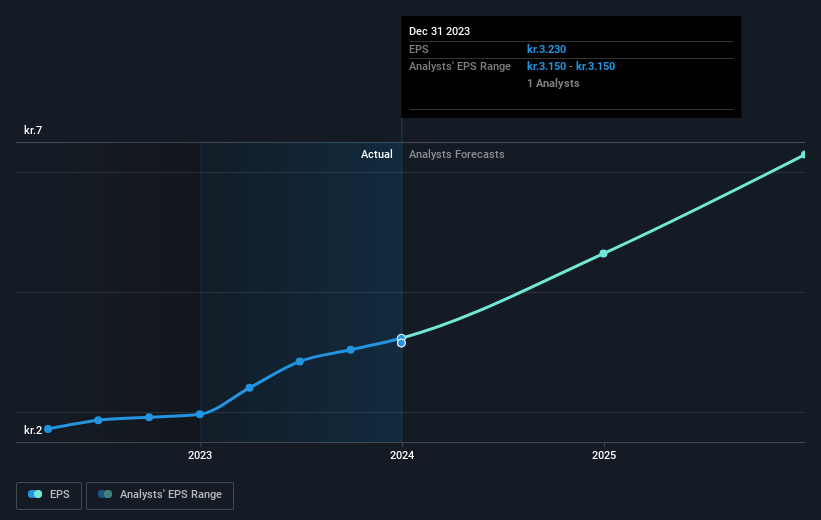
Over half a decade, cBrain managed to grow its earnings per share at 91% a year. The EPS growth is more impressive than the yearly share price gain of 55% over the same period. So it seems the market isn't so enthusiastic about the stock these days. Having said that, the market is still optimistic, given the P/E ratio of 98.16.
The company's earnings per share (over time) is depicted in the image below (click to see the exact numbers).
It is of course excellent to see how cBrain has grown profits over the years, but the future is more important for shareholders. This free interactive report on cBrain's balance sheet strength is a great place to start, if you want to investigate the stock further.
What About Dividends?
It is important to consider the total shareholder return, as well as the share price return, for any given stock. The TSR is a return calculation that accounts for the value of cash dividends (assuming that any dividend received was reinvested) and the calculated value of any discounted capital raisings and spin-offs. Arguably, the TSR gives a more comprehensive picture of the return generated by a stock. In the case of cBrain, it has a TSR of 787% for the last 5 years. That exceeds its share price return that we previously mentioned. The dividends paid by the company have thusly boosted the total shareholder return.
A Different Perspective
We're pleased to report that cBrain shareholders have received a total shareholder return of 132% over one year. Of course, that includes the dividend. Since the one-year TSR is better than the five-year TSR (the latter coming in at 55% per year), it would seem that the stock's performance has improved in recent times. In the best case scenario, this may hint at some real business momentum, implying that now could be a great time to delve deeper. It's always interesting to track share price performance over the longer term. But to understand cBrain better, we need to consider many other factors. Even so, be aware that cBrain is showing 1 warning sign in our investment analysis , you should know about...
We will like cBrain better if we see some big insider buys. While we wait, check out this free list of growing companies with considerable, recent, insider buying.
Please note, the market returns quoted in this article reflect the market weighted average returns of stocks that currently trade on Danish exchanges.
Valuation is complex, but we're helping make it simple.
Find out whether cBrain is potentially over or undervalued by checking out our comprehensive analysis, which includes fair value estimates, risks and warnings, dividends, insider transactions and financial health.
View the Free AnalysisHave feedback on this article? Concerned about the content? Get in touch with us directly. Alternatively, email editorial-team (at) simplywallst.com.
This article by Simply Wall St is general in nature. We provide commentary based on historical data and analyst forecasts only using an unbiased methodology and our articles are not intended to be financial advice. It does not constitute a recommendation to buy or sell any stock, and does not take account of your objectives, or your financial situation. We aim to bring you long-term focused analysis driven by fundamental data. Note that our analysis may not factor in the latest price-sensitive company announcements or qualitative material. Simply Wall St has no position in any stocks mentioned.
About CPSE:CBRAIN
cBrain
cBrain A/S, a software company, provides software solutions for government, private, education, and non-profit sectors in Denmark and internationally.
Exceptional growth potential with outstanding track record.
