Stock Analysis

If we want to find a potential multi-bagger, often there are underlying trends that can provide clues. In a perfect world, we'd like to see a company investing more capital into its business and ideally the returns earned from that capital are also increasing. If you see this, it typically means it's a company with a great business model and plenty of profitable reinvestment opportunities. However, after investigating Yusei Holdings (HKG:96), we don't think it's current trends fit the mold of a multi-bagger.
What Is Return On Capital Employed (ROCE)?
Just to clarify if you're unsure, ROCE is a metric for evaluating how much pre-tax income (in percentage terms) a company earns on the capital invested in its business. The formula for this calculation on Yusei Holdings is:
Return on Capital Employed = Earnings Before Interest and Tax (EBIT) ÷ (Total Assets - Current Liabilities)
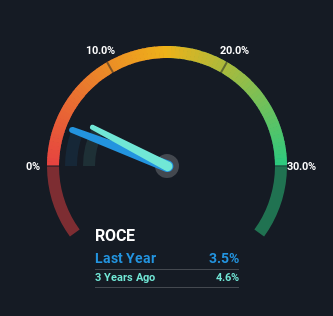
0.035 = CN¥34m ÷ (CN¥2.3b - CN¥1.3b) (Based on the trailing twelve months to December 2022).
Thus, Yusei Holdings has an ROCE of 3.5%. In absolute terms, that's a low return and it also under-performs the Chemicals industry average of 7.7%.
Check out our latest analysis for Yusei Holdings
While the past is not representative of the future, it can be helpful to know how a company has performed historically, which is why we have this chart above. If you're interested in investigating Yusei Holdings' past further, check out this free graph covering Yusei Holdings' past earnings, revenue and cash flow.
So How Is Yusei Holdings' ROCE Trending?
In terms of Yusei Holdings' historical ROCE movements, the trend isn't fantastic. To be more specific, ROCE has fallen from 17% over the last five years. However, given capital employed and revenue have both increased it appears that the business is currently pursuing growth, at the consequence of short term returns. If these investments prove successful, this can bode very well for long term stock performance.
On a separate but related note, it's important to know that Yusei Holdings has a current liabilities to total assets ratio of 58%, which we'd consider pretty high. This can bring about some risks because the company is basically operating with a rather large reliance on its suppliers or other sorts of short-term creditors. While it's not necessarily a bad thing, it can be beneficial if this ratio is lower.
Our Take On Yusei Holdings' ROCE
Even though returns on capital have fallen in the short term, we find it promising that revenue and capital employed have both increased for Yusei Holdings. These growth trends haven't led to growth returns though, since the stock has fallen 62% over the last five years. So we think it'd be worthwhile to look further into this stock given the trends look encouraging.
One more thing: We've identified 3 warning signs with Yusei Holdings (at least 1 which is significant) , and understanding these would certainly be useful.
For those who like to invest in solid companies, check out this free list of companies with solid balance sheets and high returns on equity.
Valuation is complex, but we're helping make it simple.
Find out whether Yusei Holdings is potentially over or undervalued by checking out our comprehensive analysis, which includes fair value estimates, risks and warnings, dividends, insider transactions and financial health.
View the Free AnalysisHave feedback on this article? Concerned about the content? Get in touch with us directly. Alternatively, email editorial-team (at) simplywallst.com.
This article by Simply Wall St is general in nature. We provide commentary based on historical data and analyst forecasts only using an unbiased methodology and our articles are not intended to be financial advice. It does not constitute a recommendation to buy or sell any stock, and does not take account of your objectives, or your financial situation. We aim to bring you long-term focused analysis driven by fundamental data. Note that our analysis may not factor in the latest price-sensitive company announcements or qualitative material. Simply Wall St has no position in any stocks mentioned.

Simply Wall St
About SEHK:96
Yusei Holdings
Yusei Holdings Limited, an investment holding company, primarily engages in the design, development, and fabrication of precision plastic injection molds in the People’s Republic of China.
Slightly overvalued with questionable track record.
