Stock Analysis
- Belgium
- /
- Metals and Mining
- /
- ENXTBR:CAMB
Campine NV's (EBR:CAMB) Shares Not Telling The Full Story
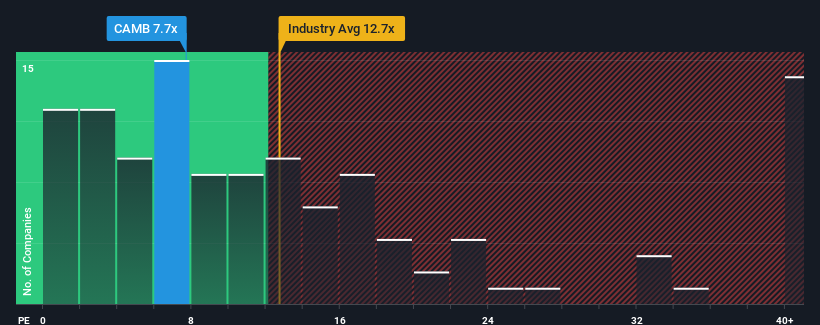
With a price-to-earnings (or "P/E") ratio of 7.7x Campine NV (EBR:CAMB) may be sending bullish signals at the moment, given that almost half of all companies in Belgium have P/E ratios greater than 15x and even P/E's higher than 29x are not unusual. However, the P/E might be low for a reason and it requires further investigation to determine if it's justified.
For example, consider that Campine's financial performance has been poor lately as its earnings have been in decline. One possibility is that the P/E is low because investors think the company won't do enough to avoid underperforming the broader market in the near future. If you like the company, you'd be hoping this isn't the case so that you could potentially pick up some stock while it's out of favour.
Check out our latest analysis for Campine
Is There Any Growth For Campine?
Campine's P/E ratio would be typical for a company that's only expected to deliver limited growth, and importantly, perform worse than the market.
Taking a look back first, the company's earnings per share growth last year wasn't something to get excited about as it posted a disappointing decline of 14%. Still, the latest three year period has seen an excellent 390% overall rise in EPS, in spite of its unsatisfying short-term performance. So we can start by confirming that the company has generally done a very good job of growing earnings over that time, even though it had some hiccups along the way.
Weighing that recent medium-term earnings trajectory against the broader market's one-year forecast for expansion of 26% shows it's noticeably more attractive on an annualised basis.
With this information, we find it odd that Campine is trading at a P/E lower than the market. It looks like most investors are not convinced the company can maintain its recent growth rates.
The Key Takeaway
While the price-to-earnings ratio shouldn't be the defining factor in whether you buy a stock or not, it's quite a capable barometer of earnings expectations.
Our examination of Campine revealed its three-year earnings trends aren't contributing to its P/E anywhere near as much as we would have predicted, given they look better than current market expectations. When we see strong earnings with faster-than-market growth, we assume potential risks are what might be placing significant pressure on the P/E ratio. At least price risks look to be very low if recent medium-term earnings trends continue, but investors seem to think future earnings could see a lot of volatility.
Don't forget that there may be other risks. For instance, we've identified 2 warning signs for Campine that you should be aware of.
Of course, you might also be able to find a better stock than Campine. So you may wish to see this free collection of other companies that have reasonable P/E ratios and have grown earnings strongly.
Valuation is complex, but we're helping make it simple.
Find out whether Campine is potentially over or undervalued by checking out our comprehensive analysis, which includes fair value estimates, risks and warnings, dividends, insider transactions and financial health.
View the Free AnalysisHave feedback on this article? Concerned about the content? Get in touch with us directly. Alternatively, email editorial-team (at) simplywallst.com.
This article by Simply Wall St is general in nature. We provide commentary based on historical data and analyst forecasts only using an unbiased methodology and our articles are not intended to be financial advice. It does not constitute a recommendation to buy or sell any stock, and does not take account of your objectives, or your financial situation. We aim to bring you long-term focused analysis driven by fundamental data. Note that our analysis may not factor in the latest price-sensitive company announcements or qualitative material. Simply Wall St has no position in any stocks mentioned.

Simply Wall St
About ENXTBR:CAMB
Campine
Campine NV engages in the circular metals and specialty chemicals businesses.
Flawless balance sheet second-rate dividend payer.
