Stock Analysis
- Canada
- /
- Trade Distributors
- /
- TSX:TIH
Are Toromont Industries Ltd. (TSE:TIH) Investors Paying Above The Intrinsic Value?

Key Insights
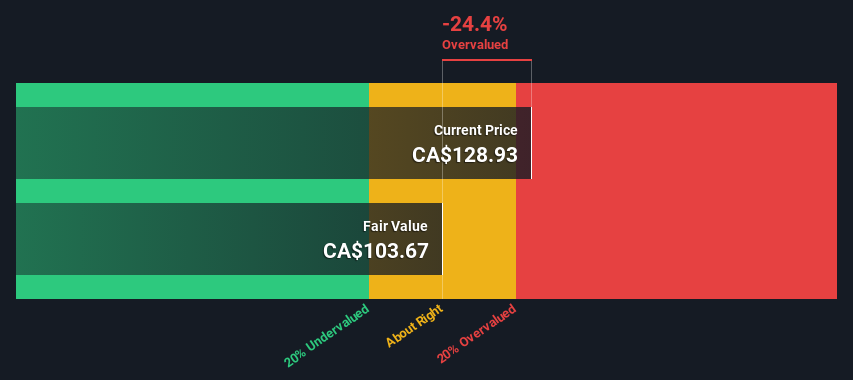
- The projected fair value for Toromont Industries is CA$104 based on 2 Stage Free Cash Flow to Equity
- Toromont Industries' CA$129 share price signals that it might be 24% overvalued
- Our fair value estimate is 24% lower than Toromont Industries' analyst price target of CA$136
How far off is Toromont Industries Ltd. (TSE:TIH) from its intrinsic value? Using the most recent financial data, we'll take a look at whether the stock is fairly priced by taking the forecast future cash flows of the company and discounting them back to today's value. We will use the Discounted Cash Flow (DCF) model on this occasion. There's really not all that much to it, even though it might appear quite complex.
We would caution that there are many ways of valuing a company and, like the DCF, each technique has advantages and disadvantages in certain scenarios. If you still have some burning questions about this type of valuation, take a look at the Simply Wall St analysis model.
Check out our latest analysis for Toromont Industries
Is Toromont Industries Fairly Valued?
We use what is known as a 2-stage model, which simply means we have two different periods of growth rates for the company's cash flows. Generally the first stage is higher growth, and the second stage is a lower growth phase. In the first stage we need to estimate the cash flows to the business over the next ten years. Where possible we use analyst estimates, but when these aren't available we extrapolate the previous free cash flow (FCF) from the last estimate or reported value. We assume companies with shrinking free cash flow will slow their rate of shrinkage, and that companies with growing free cash flow will see their growth rate slow, over this period. We do this to reflect that growth tends to slow more in the early years than it does in later years.
A DCF is all about the idea that a dollar in the future is less valuable than a dollar today, so we need to discount the sum of these future cash flows to arrive at a present value estimate:
10-year free cash flow (FCF) forecast
| 2024 | 2025 | 2026 | 2027 | 2028 | 2029 | 2030 | 2031 | 2032 | 2033 | |
| Levered FCF (CA$, Millions) | CA$416.0m | CA$455.6m | CA$456.7m | CA$460.1m | CA$465.3m | CA$471.7m | CA$479.1m | CA$487.2m | CA$495.9m | CA$505.1m |
| Growth Rate Estimate Source | Analyst x3 | Analyst x3 | Analyst x1 | Est @ 0.75% | Est @ 1.12% | Est @ 1.38% | Est @ 1.57% | Est @ 1.69% | Est @ 1.78% | Est @ 1.84% |
| Present Value (CA$, Millions) Discounted @ 7.0% | CA$389 | CA$398 | CA$373 | CA$351 | CA$332 | CA$315 | CA$299 | CA$284 | CA$270 | CA$257 |
("Est" = FCF growth rate estimated by Simply Wall St)
Present Value of 10-year Cash Flow (PVCF) = CA$3.3b
The second stage is also known as Terminal Value, this is the business's cash flow after the first stage. For a number of reasons a very conservative growth rate is used that cannot exceed that of a country's GDP growth. In this case we have used the 5-year average of the 10-year government bond yield (2.0%) to estimate future growth. In the same way as with the 10-year 'growth' period, we discount future cash flows to today's value, using a cost of equity of 7.0%.
Terminal Value (TV)= FCF2033 × (1 + g) ÷ (r – g) = CA$505m× (1 + 2.0%) ÷ (7.0%– 2.0%) = CA$10b
Present Value of Terminal Value (PVTV)= TV / (1 + r)10= CA$10b÷ ( 1 + 7.0%)10= CA$5.3b
The total value is the sum of cash flows for the next ten years plus the discounted terminal value, which results in the Total Equity Value, which in this case is CA$8.5b. In the final step we divide the equity value by the number of shares outstanding. Compared to the current share price of CA$129, the company appears slightly overvalued at the time of writing. Valuations are imprecise instruments though, rather like a telescope - move a few degrees and end up in a different galaxy. Do keep this in mind.
Important Assumptions
Now the most important inputs to a discounted cash flow are the discount rate, and of course, the actual cash flows. Part of investing is coming up with your own evaluation of a company's future performance, so try the calculation yourself and check your own assumptions. The DCF also does not consider the possible cyclicality of an industry, or a company's future capital requirements, so it does not give a full picture of a company's potential performance. Given that we are looking at Toromont Industries as potential shareholders, the cost of equity is used as the discount rate, rather than the cost of capital (or weighted average cost of capital, WACC) which accounts for debt. In this calculation we've used 7.0%, which is based on a levered beta of 1.085. Beta is a measure of a stock's volatility, compared to the market as a whole. We get our beta from the industry average beta of globally comparable companies, with an imposed limit between 0.8 and 2.0, which is a reasonable range for a stable business.
SWOT Analysis for Toromont Industries
- Earnings growth over the past year exceeded the industry.
- Debt is not viewed as a risk.
- Dividends are covered by earnings and cash flows.
- Dividend is low compared to the top 25% of dividend payers in the Trade Distributors market.
- Expensive based on P/E ratio and estimated fair value.
- Annual earnings are forecast to grow for the next 2 years.
- Annual earnings are forecast to grow slower than the Canadian market.
Moving On:
Valuation is only one side of the coin in terms of building your investment thesis, and it ideally won't be the sole piece of analysis you scrutinize for a company. It's not possible to obtain a foolproof valuation with a DCF model. Preferably you'd apply different cases and assumptions and see how they would impact the company's valuation. If a company grows at a different rate, or if its cost of equity or risk free rate changes sharply, the output can look very different. Why is the intrinsic value lower than the current share price? For Toromont Industries, there are three further elements you should assess:
- Financial Health: Does TIH have a healthy balance sheet? Take a look at our free balance sheet analysis with six simple checks on key factors like leverage and risk.
- Management:Have insiders been ramping up their shares to take advantage of the market's sentiment for TIH's future outlook? Check out our management and board analysis with insights on CEO compensation and governance factors.
- Other Solid Businesses: Low debt, high returns on equity and good past performance are fundamental to a strong business. Why not explore our interactive list of stocks with solid business fundamentals to see if there are other companies you may not have considered!
PS. Simply Wall St updates its DCF calculation for every Canadian stock every day, so if you want to find the intrinsic value of any other stock just search here.
Valuation is complex, but we're helping make it simple.
Find out whether Toromont Industries is potentially over or undervalued by checking out our comprehensive analysis, which includes fair value estimates, risks and warnings, dividends, insider transactions and financial health.
View the Free AnalysisHave feedback on this article? Concerned about the content? Get in touch with us directly. Alternatively, email editorial-team (at) simplywallst.com.
This article by Simply Wall St is general in nature. We provide commentary based on historical data and analyst forecasts only using an unbiased methodology and our articles are not intended to be financial advice. It does not constitute a recommendation to buy or sell any stock, and does not take account of your objectives, or your financial situation. We aim to bring you long-term focused analysis driven by fundamental data. Note that our analysis may not factor in the latest price-sensitive company announcements or qualitative material. Simply Wall St has no position in any stocks mentioned.

Simply Wall St
About TSX:TIH
Toromont Industries
Toromont Industries Ltd. provides specialized capital equipment in Canada, the United States, and internationally.
Flawless balance sheet with solid track record and pays a dividend.
