Stock Analysis
- Sweden
- /
- Hospitality
- /
- OM:ATIC
Actic Group Full Year 2023 Earnings: kr1.83 loss per share (vs kr1.82 loss in FY 2022)


Actic Group (STO:ATIC) Full Year 2023 Results
Key Financial Results
- Revenue: kr732.1m (down 8.1% from FY 2022).
- Net loss: kr40.7m (loss widened by 13% from FY 2022).
- kr1.83 loss per share (further deteriorated from kr1.82 loss in FY 2022).
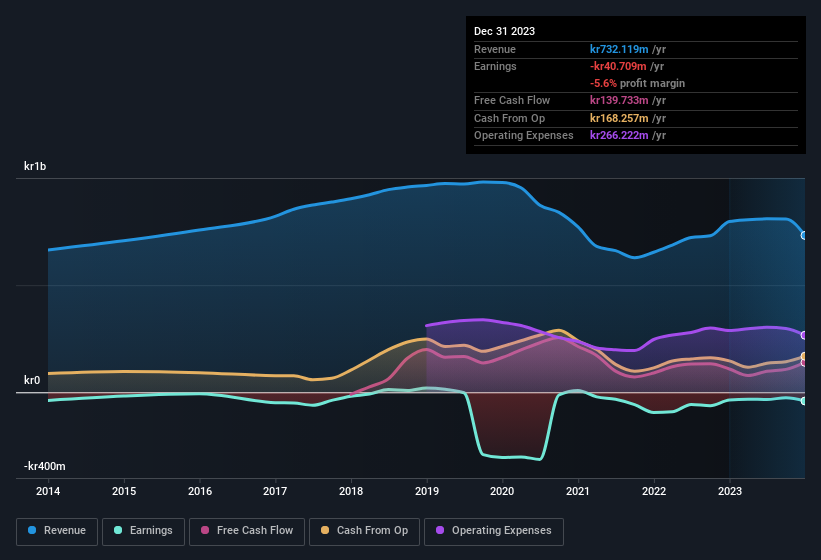
All figures shown in the chart above are for the trailing 12 month (TTM) period
Actic Group shares are up 1.6% from a week ago.
Risk Analysis
It's necessary to consider the ever-present spectre of investment risk. We've identified 2 warning signs with Actic Group (at least 1 which is a bit concerning), and understanding these should be part of your investment process.
Valuation is complex, but we're helping make it simple.
Find out whether Actic Group is potentially over or undervalued by checking out our comprehensive analysis, which includes fair value estimates, risks and warnings, dividends, insider transactions and financial health.
View the Free AnalysisHave feedback on this article? Concerned about the content? Get in touch with us directly. Alternatively, email editorial-team (at) simplywallst.com.
This article by Simply Wall St is general in nature. We provide commentary based on historical data and analyst forecasts only using an unbiased methodology and our articles are not intended to be financial advice. It does not constitute a recommendation to buy or sell any stock, and does not take account of your objectives, or your financial situation. We aim to bring you long-term focused analysis driven by fundamental data. Note that our analysis may not factor in the latest price-sensitive company announcements or qualitative material. Simply Wall St has no position in any stocks mentioned.
About OM:ATIC
Actic Group
Actic Group AB (publ) operates gyms and wellness facilities in Sweden, Norway, Germany, and Austria.
Good value with imperfect balance sheet.
