Stock Analysis


Key Insights
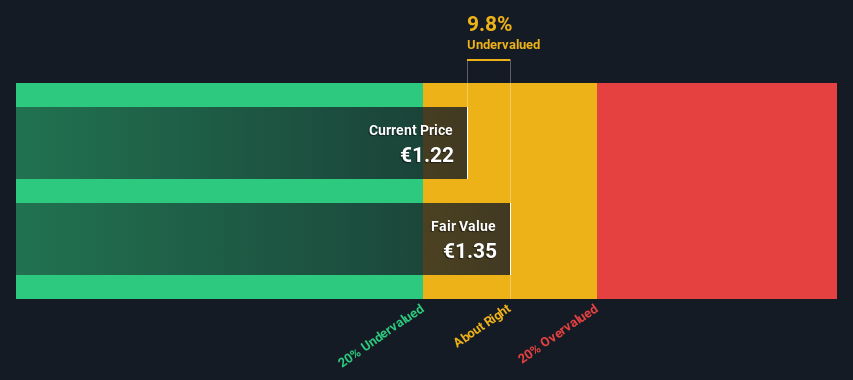
- Using the 2 Stage Free Cash Flow to Equity, Softlab fair value estimate is €1.35
- Current share price of €1.22 suggests Softlab is potentially trading close to its fair value
- The average premium for Softlab's competitorsis currently 37%
Today we will run through one way of estimating the intrinsic value of Softlab S.p.A. (BIT:SFT) by taking the expected future cash flows and discounting them to their present value. We will use the Discounted Cash Flow (DCF) model on this occasion. It may sound complicated, but actually it is quite simple!
We generally believe that a company's value is the present value of all of the cash it will generate in the future. However, a DCF is just one valuation metric among many, and it is not without flaws. If you want to learn more about discounted cash flow, the rationale behind this calculation can be read in detail in the Simply Wall St analysis model.
See our latest analysis for Softlab
What's The Estimated Valuation?
We use what is known as a 2-stage model, which simply means we have two different periods of growth rates for the company's cash flows. Generally the first stage is higher growth, and the second stage is a lower growth phase. To begin with, we have to get estimates of the next ten years of cash flows. Seeing as no analyst estimates of free cash flow are available to us, we have extrapolate the previous free cash flow (FCF) from the company's last reported value. We assume companies with shrinking free cash flow will slow their rate of shrinkage, and that companies with growing free cash flow will see their growth rate slow, over this period. We do this to reflect that growth tends to slow more in the early years than it does in later years.
Generally we assume that a dollar today is more valuable than a dollar in the future, so we discount the value of these future cash flows to their estimated value in today's dollars:
10-year free cash flow (FCF) forecast
| 2024 | 2025 | 2026 | 2027 | 2028 | 2029 | 2030 | 2031 | 2032 | 2033 | |
| Levered FCF (€, Millions) | €2.21m | €2.01m | €1.90m | €1.84m | €1.81m | €1.80m | €1.81m | €1.83m | €1.85m | €1.88m |
| Growth Rate Estimate Source | Est @ -13.62% | Est @ -8.85% | Est @ -5.52% | Est @ -3.19% | Est @ -1.55% | Est @ -0.41% | Est @ 0.39% | Est @ 0.95% | Est @ 1.34% | Est @ 1.62% |
| Present Value (€, Millions) Discounted @ 11% | €2.0 | €1.6 | €1.4 | €1.2 | €1.1 | €0.9 | €0.8 | €0.8 | €0.7 | €0.6 |
("Est" = FCF growth rate estimated by Simply Wall St)
Present Value of 10-year Cash Flow (PVCF) = €11m
The second stage is also known as Terminal Value, this is the business's cash flow after the first stage. The Gordon Growth formula is used to calculate Terminal Value at a future annual growth rate equal to the 5-year average of the 10-year government bond yield of 2.3%. We discount the terminal cash flows to today's value at a cost of equity of 11%.
Terminal Value (TV)= FCF2033 × (1 + g) ÷ (r – g) = €1.9m× (1 + 2.3%) ÷ (11%– 2.3%) = €21m
Present Value of Terminal Value (PVTV)= TV / (1 + r)10= €21m÷ ( 1 + 11%)10= €7.1m
The total value, or equity value, is then the sum of the present value of the future cash flows, which in this case is €18m. In the final step we divide the equity value by the number of shares outstanding. Relative to the current share price of €1.2, the company appears about fair value at a 9.8% discount to where the stock price trades currently. The assumptions in any calculation have a big impact on the valuation, so it is better to view this as a rough estimate, not precise down to the last cent.
Important Assumptions
The calculation above is very dependent on two assumptions. The first is the discount rate and the other is the cash flows. If you don't agree with these result, have a go at the calculation yourself and play with the assumptions. The DCF also does not consider the possible cyclicality of an industry, or a company's future capital requirements, so it does not give a full picture of a company's potential performance. Given that we are looking at Softlab as potential shareholders, the cost of equity is used as the discount rate, rather than the cost of capital (or weighted average cost of capital, WACC) which accounts for debt. In this calculation we've used 11%, which is based on a levered beta of 1.176. Beta is a measure of a stock's volatility, compared to the market as a whole. We get our beta from the industry average beta of globally comparable companies, with an imposed limit between 0.8 and 2.0, which is a reasonable range for a stable business.
SWOT Analysis for Softlab
- Debt is not viewed as a risk.
- Earnings declined over the past year.
- Current share price is below our estimate of fair value.
- Lack of analyst coverage makes it difficult to determine SFT's earnings prospects.
- No apparent threats visible for SFT.
Moving On:
Although the valuation of a company is important, it is only one of many factors that you need to assess for a company. DCF models are not the be-all and end-all of investment valuation. Rather it should be seen as a guide to "what assumptions need to be true for this stock to be under/overvalued?" For instance, if the terminal value growth rate is adjusted slightly, it can dramatically alter the overall result. For Softlab, there are three further items you should further research:
- Risks: Be aware that Softlab is showing 2 warning signs in our investment analysis , and 1 of those shouldn't be ignored...
- Other Solid Businesses: Low debt, high returns on equity and good past performance are fundamental to a strong business. Why not explore our interactive list of stocks with solid business fundamentals to see if there are other companies you may not have considered!
- Other Environmentally-Friendly Companies: Concerned about the environment and think consumers will buy eco-friendly products more and more? Browse through our interactive list of companies that are thinking about a greener future to discover some stocks you may not have thought of!
PS. The Simply Wall St app conducts a discounted cash flow valuation for every stock on the BIT every day. If you want to find the calculation for other stocks just search here.
Valuation is complex, but we're helping make it simple.
Find out whether Softlab is potentially over or undervalued by checking out our comprehensive analysis, which includes fair value estimates, risks and warnings, dividends, insider transactions and financial health.
View the Free AnalysisHave feedback on this article? Concerned about the content? Get in touch with us directly. Alternatively, email editorial-team (at) simplywallst.com.
This article by Simply Wall St is general in nature. We provide commentary based on historical data and analyst forecasts only using an unbiased methodology and our articles are not intended to be financial advice. It does not constitute a recommendation to buy or sell any stock, and does not take account of your objectives, or your financial situation. We aim to bring you long-term focused analysis driven by fundamental data. Note that our analysis may not factor in the latest price-sensitive company announcements or qualitative material. Simply Wall St has no position in any stocks mentioned.
About BIT:SFT
Softlab
Softlab S.p.A. provides various business development services in Italy, rest of European countries, the United States, and internationally.
Excellent balance sheet and fair value.
