Stock Analysis
- United States
- /
- Aerospace & Defense
- /
- NYSE:RTX
A Look At The Intrinsic Value Of RTX Corporation (NYSE:RTX)
Key Insights
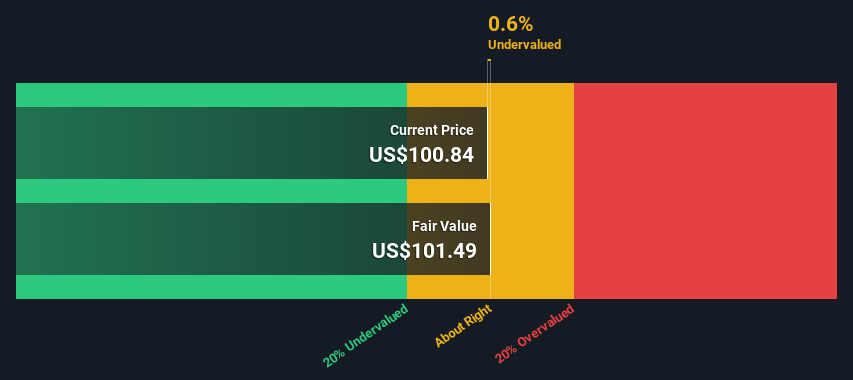
- RTX's estimated fair value is US$101 based on 2 Stage Free Cash Flow to Equity
- Current share price of US$101 suggests RTX is potentially trading close to its fair value
- Analyst price target for RTX is US$100 which is 1.3% below our fair value estimate
Does the April share price for RTX Corporation (NYSE:RTX) reflect what it's really worth? Today, we will estimate the stock's intrinsic value by estimating the company's future cash flows and discounting them to their present value. Our analysis will employ the Discounted Cash Flow (DCF) model. It may sound complicated, but actually it is quite simple!
We generally believe that a company's value is the present value of all of the cash it will generate in the future. However, a DCF is just one valuation metric among many, and it is not without flaws. For those who are keen learners of equity analysis, the Simply Wall St analysis model here may be something of interest to you.
View our latest analysis for RTX
The Calculation
We're using the 2-stage growth model, which simply means we take in account two stages of company's growth. In the initial period the company may have a higher growth rate and the second stage is usually assumed to have a stable growth rate. To start off with, we need to estimate the next ten years of cash flows. Where possible we use analyst estimates, but when these aren't available we extrapolate the previous free cash flow (FCF) from the last estimate or reported value. We assume companies with shrinking free cash flow will slow their rate of shrinkage, and that companies with growing free cash flow will see their growth rate slow, over this period. We do this to reflect that growth tends to slow more in the early years than it does in later years.
Generally we assume that a dollar today is more valuable than a dollar in the future, so we need to discount the sum of these future cash flows to arrive at a present value estimate:
10-year free cash flow (FCF) forecast
| 2024 | 2025 | 2026 | 2027 | 2028 | 2029 | 2030 | 2031 | 2032 | 2033 | |
| Levered FCF ($, Millions) | US$5.70b | US$7.02b | US$8.41b | US$9.59b | US$8.21b | US$7.45b | US$7.01b | US$6.78b | US$6.66b | US$6.63b |
| Growth Rate Estimate Source | Analyst x11 | Analyst x13 | Analyst x9 | Analyst x2 | Analyst x1 | Est @ -9.30% | Est @ -5.82% | Est @ -3.39% | Est @ -1.68% | Est @ -0.49% |
| Present Value ($, Millions) Discounted @ 6.6% | US$5.3k | US$6.2k | US$6.9k | US$7.4k | US$6.0k | US$5.1k | US$4.5k | US$4.1k | US$3.7k | US$3.5k |
("Est" = FCF growth rate estimated by Simply Wall St)
Present Value of 10-year Cash Flow (PVCF) = US$53b
We now need to calculate the Terminal Value, which accounts for all the future cash flows after this ten year period. The Gordon Growth formula is used to calculate Terminal Value at a future annual growth rate equal to the 5-year average of the 10-year government bond yield of 2.3%. We discount the terminal cash flows to today's value at a cost of equity of 6.6%.
Terminal Value (TV)= FCF2033 × (1 + g) ÷ (r – g) = US$6.6b× (1 + 2.3%) ÷ (6.6%– 2.3%) = US$156b
Present Value of Terminal Value (PVTV)= TV / (1 + r)10= US$156b÷ ( 1 + 6.6%)10= US$82b
The total value, or equity value, is then the sum of the present value of the future cash flows, which in this case is US$135b. In the final step we divide the equity value by the number of shares outstanding. Relative to the current share price of US$101, the company appears about fair value at a 0.6% discount to where the stock price trades currently. Remember though, that this is just an approximate valuation, and like any complex formula - garbage in, garbage out.
Important Assumptions
The calculation above is very dependent on two assumptions. The first is the discount rate and the other is the cash flows. You don't have to agree with these inputs, I recommend redoing the calculations yourself and playing with them. The DCF also does not consider the possible cyclicality of an industry, or a company's future capital requirements, so it does not give a full picture of a company's potential performance. Given that we are looking at RTX as potential shareholders, the cost of equity is used as the discount rate, rather than the cost of capital (or weighted average cost of capital, WACC) which accounts for debt. In this calculation we've used 6.6%, which is based on a levered beta of 0.945. Beta is a measure of a stock's volatility, compared to the market as a whole. We get our beta from the industry average beta of globally comparable companies, with an imposed limit between 0.8 and 2.0, which is a reasonable range for a stable business.
SWOT Analysis for RTX
- Debt is well covered by earnings.
- Earnings declined over the past year.
- Dividend is low compared to the top 25% of dividend payers in the Aerospace & Defense market.
- Annual earnings are forecast to grow faster than the American market.
- Current share price is below our estimate of fair value.
- Debt is not well covered by operating cash flow.
- Dividends are not covered by earnings.
- Annual revenue is forecast to grow slower than the American market.
Moving On:
Although the valuation of a company is important, it shouldn't be the only metric you look at when researching a company. It's not possible to obtain a foolproof valuation with a DCF model. Preferably you'd apply different cases and assumptions and see how they would impact the company's valuation. For example, changes in the company's cost of equity or the risk free rate can significantly impact the valuation. For RTX, we've put together three pertinent items you should explore:
- Risks: Be aware that RTX is showing 4 warning signs in our investment analysis , and 1 of those is potentially serious...
- Future Earnings: How does RTX's growth rate compare to its peers and the wider market? Dig deeper into the analyst consensus number for the upcoming years by interacting with our free analyst growth expectation chart.
- Other High Quality Alternatives: Do you like a good all-rounder? Explore our interactive list of high quality stocks to get an idea of what else is out there you may be missing!
PS. The Simply Wall St app conducts a discounted cash flow valuation for every stock on the NYSE every day. If you want to find the calculation for other stocks just search here.
Valuation is complex, but we're helping make it simple.
Find out whether RTX is potentially over or undervalued by checking out our comprehensive analysis, which includes fair value estimates, risks and warnings, dividends, insider transactions and financial health.
View the Free AnalysisHave feedback on this article? Concerned about the content? Get in touch with us directly. Alternatively, email editorial-team (at) simplywallst.com.
This article by Simply Wall St is general in nature. We provide commentary based on historical data and analyst forecasts only using an unbiased methodology and our articles are not intended to be financial advice. It does not constitute a recommendation to buy or sell any stock, and does not take account of your objectives, or your financial situation. We aim to bring you long-term focused analysis driven by fundamental data. Note that our analysis may not factor in the latest price-sensitive company announcements or qualitative material. Simply Wall St has no position in any stocks mentioned.

Simply Wall St
About NYSE:RTX
RTX
RTX Corporation, an aerospace and defense company, provides systems and services for the commercial, military, and government customers in the United States and internationally.
Adequate balance sheet second-rate dividend payer.
