
Last Update 16 Jun 26
DSY: Stable Outlook Will Rely On Unchanged Assumptions For Future Upside Potential
The latest Discovery price target remains steady at ZAR301.19, as analysts cite unchanged fair value, discount rate, revenue growth, profit margin and future P/E assumptions in their updated models.
What’s in the News for Discovery
- No recent Discovery news items are available from the provided primary sources.
- No Discovery related coverage is available from the supplied periodicals data.
- No specific Discovery key developments have been provided in the current dataset.
Valuation Changes
- Fair Value: ZAR301.19 remains unchanged, indicating no adjustment to the central valuation estimate for Discovery stock in the updated model.
- Discount Rate: The discount rate is effectively unchanged at 16.254%, with only a minimal rounding difference in the updated figure.
- Revenue Growth: Forecast ZAR revenue growth is stable at approximately 54.70%, with the updated value closely matching the prior assumption.
- Net Profit Margin: The projected net profit margin remains steady at about 18.04%, with no material change in the updated input.
- Future P/E: The expected future P/E ratio stays in line with the prior assumption at roughly 19.59x, reflecting consistent earnings multiple expectations in the model.
Key Takeaways
- Discovery's restructuring and robust operating profit growth are poised to exceed earnings expectations and drive higher revenue and net margins.
- Scaling down investments in new initiatives, coupled with Discovery Bank's profitability, is expected to improve cash flow and contribute significantly to revenue growth.
- Global market exposure and high upfront investments could strain Discovery's financial stability, impacting margins and short-term profitability amidst socioeconomic pressures.
Catalysts
About Discovery- Provides various insurance products and services primarily in South Africa and the United Kingdom.
- Discovery has restructured its group into two distinct composites, Discovery SA and Vitality Global, which is expected to initiate a high-growth phase for the company, impacting revenue and earnings growth.
- Discovery's robust operating profit growth of 27% and the expectation to maintain growth above the 15% to 20% target corridor suggest that it will exceed earnings growth expectations, driving higher revenue and net margins.
- The scaling down of investments in new initiatives and the reduced need for capital funding should lead to increased cash flow and improved net margin as financial leverage decreases and earnings grow.
- Discovery Bank, which has recently become profitable, with expectations of reaching ZAR 3 billion in profitability by 2029, is anticipated to drive earnings growth and contribute to Discovery SA's revenue.
- The Vitality shared value model is positioned to enhance global scaling and improve net margins by reducing claims and lapsation rates, supported by data-driven health initiatives and partnerships that are expected to expand the global reach and revenue streams.
Discovery Future Earnings and Revenue Growth
Assumptions
How have these above catalysts been quantified?
- Analysts are assuming Discovery's revenue will remain fairly flat over the next 3 years.
- Analysts assume that profit margins will increase from 11.6% today to 18.0% in 3 years time.
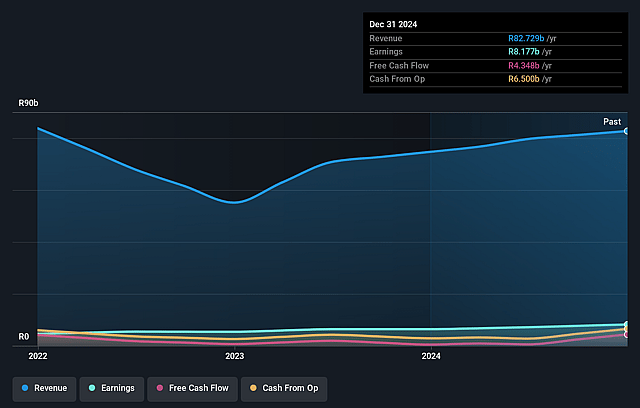
- Analysts expect earnings to reach ZAR 16.7 billion (and earnings per share of ZAR 21.97) by about June 2029, up from ZAR 10.6 billion today.
- In order for the above numbers to justify the price target of the analysts, the company would need to trade at a PE ratio of 19.6x on those 2029 earnings, up from 18.1x today. This future PE is greater than the current PE for the ZA Insurance industry at 11.0x.
- Analysts expect the number of shares outstanding to grow by 0.92% per year for the next 3 years.
- To value all of this in today's terms, we will use a discount rate of 16.25%, as per the Simply Wall St company report.
Risks
What could happen that would invalidate this narrative?- The volatility in the markets and geopolitical risks, such as trade rules, tariffs, and potential conflicts, could impact Discovery's earnings and financial stability due to exposure to global markets and ForEx volatility.
- High medical inflation and adverse selection affecting Discovery Health may pressure margins and increase costs, impacting net margins in the health insurance sector.
- Discovery's reliance on a long-term business model with significant upfront investments, like in Discovery Bank, could strain cash flow and capital deployment, impacting short-term profitability and leverage ratios.
- Pressure on the socioeconomic and demographic factors in markets like China and the UK, such as aging populations, could add risk to revenue sustainability in Ping An Health and Vitality Global sectors.
- The strategic and operational costs associated with global expansion and partnerships, such as high start-up costs for tech ventures like Amplify Health, could pose a risk to their path to profitability and shareholder returns.
Valuation
How have all the factors above been brought together to estimate a fair value?
- The analysts have a consensus price target of ZAR301.19 for Discovery based on their expectations of its future earnings growth, profit margins and other risk factors.
- However, there is a degree of disagreement amongst analysts, with the most bullish reporting a price target of ZAR351.01, and the most bearish reporting a price target of just ZAR240.0.
- In order for you to agree with the analysts, you'd need to believe that by 2029, revenues will be ZAR92.6 billion, earnings will come to ZAR16.7 billion, and it would be trading on a PE ratio of 19.6x, assuming you use a discount rate of 16.3%.
- Given the current share price of ZAR285.55, the analyst price target of ZAR301.19 is 5.2% higher. The relatively low difference between the current share price and the analyst consensus price target indicates that they believe on average, the company is fairly priced.
- We always encourage you to reach your own conclusions though. So sense check these analyst numbers against your own assumptions and expectations based on your understanding of the business and what you believe is probable.
Have other thoughts on Discovery?
Create your own narrative on this stock, and estimate its Fair Value using our Valuator tool.
Create NarrativeHow well do narratives help inform your perspective?
Disclaimer
AnalystConsensusTarget is a tool utilizing a Large Language Model (LLM) that ingests data on consensus price targets, forecasted revenue and earnings figures, as well as the transcripts of earnings calls to produce qualitative analysis. The narratives produced by AnalystConsensusTarget are general in nature and are based solely on analyst data and publicly-available material published by the respective companies. These scenarios are not indicative of the company's future performance and are exploratory in nature. Simply Wall St has no position in the company(s) mentioned. Simply Wall St may provide the securities issuer or related entities with website advertising services for a fee, on an arm's length basis. These relationships have no impact on the way we conduct our business, the content we host, or how our content is served to users. The price targets and estimates used are consensus data, and do not constitute a recommendation to buy or sell any stock, and they do not take account of your objectives, or your financial situation. Note that AnalystConsensusTarget's analysis may not factor in the latest price-sensitive company announcements or qualitative material.
