


Last Update01 May 25
Key Takeaways
- Successful joint ventures and strategic expansion efforts are enhancing business synergies and have the potential to significantly boost future earnings.
- Entry into the EV segment and diversification of the product portfolio are expected to drive long-term revenue growth and profitability.
- Economic slowdown and high debt levels could impact Sandhar Technologies' financial health and growth, with risks from inflation, trade gaps, and geopolitical uncertainties.
Catalysts
About Sandhar Technologies- Engages in the manufacturing and assembling of automotive components for automotive industry in India and internationally.
- Sandhar Technologies is seeing strong growth in its joint ventures and is optimistic about maintaining this momentum, likely benefiting future earnings through improved business synergies and cost control.
- The company's expansion projects, such as those in Pune for cabins and fabrication and die casting, are expected to start commercial production by March 2025, potentially boosting future revenue.
- Sandhar's entry into the EV segment with battery chargers could drive future revenue growth, especially as they begin commercial production and expand their customer base.
- Localization and enhanced business synergies are expected to continue driving profitability, as evidenced by the joint ventures being PAT positive and having an average EBITDA of 12.5%, potentially improving net margins.
- Sandhar is actively working on diversifying its product portfolio and expanding its customer base, which should lead to increased content per vehicle, supporting revenue growth and earnings stability.
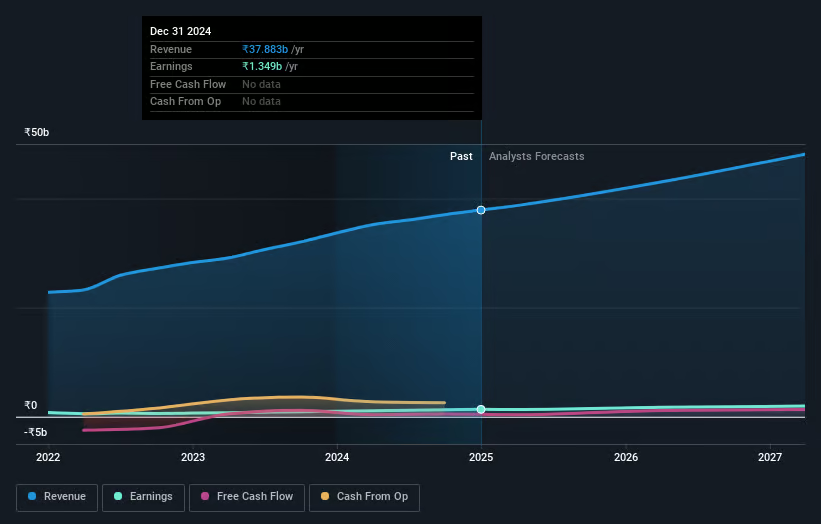
Sandhar Technologies Future Earnings and Revenue Growth
Assumptions
How have these above catalysts been quantified?- Analysts are assuming Sandhar Technologies's revenue will grow by 11.1% annually over the next 3 years.
- Analysts assume that profit margins will increase from 3.6% today to 4.3% in 3 years time.
- Analysts expect earnings to reach ₹2.3 billion (and earnings per share of ₹36.8) by about May 2028, up from ₹1.3 billion today.
- In order for the above numbers to justify the analysts price target, the company would need to trade at a PE ratio of 23.4x on those 2028 earnings, up from 16.5x today. This future PE is lower than the current PE for the IN Auto Components industry at 28.3x.
- Analysts expect the number of shares outstanding to grow by 0.11% per year for the next 3 years.
- To value all of this in today's terms, we will use a discount rate of 14.73%, as per the Simply Wall St company report.
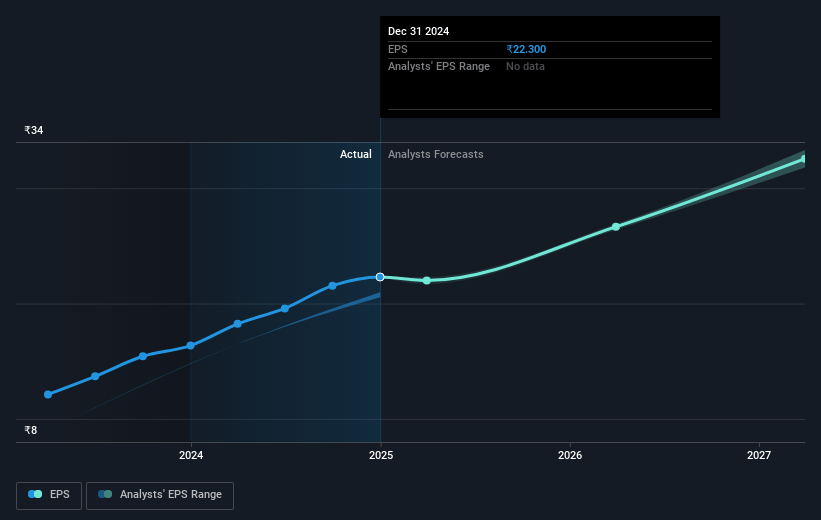
Sandhar Technologies Future Earnings Per Share Growth
Risks
What could happen that would invalidate this narrative?- The economic growth rate in India has been revised downward, affecting projections. The slowdown in manufacturing and corporate investments may impact Sandhar Technologies' revenue growth.
- High inflation, low capital flows, and a record trade gap in India could pose risks to economic stability, potentially affecting Sandhar Technologies' net margins.
- The drag on Sandhar's overseas business, especially in Europe, due to low demand and economic slowdown, could negatively impact overall earnings.
- Continued high debt levels due to ongoing capital expenditures could pressure Sandhar Technologies' financial health, potentially affecting net margins and profitability.
- The potential impact of tariffs and geopolitical uncertainties on its exports to North America could lead to revenue volatility.
Valuation
How have all the factors above been brought together to estimate a fair value?- The analysts have a consensus price target of ₹581.0 for Sandhar Technologies based on their expectations of its future earnings growth, profit margins and other risk factors.
- In order for you to agree with the analyst's consensus, you'd need to believe that by 2028, revenues will be ₹52.0 billion, earnings will come to ₹2.3 billion, and it would be trading on a PE ratio of 23.4x, assuming you use a discount rate of 14.7%.
- Given the current share price of ₹370.85, the analyst price target of ₹581.0 is 36.2% higher.
- We always encourage you to reach your own conclusions though. So sense check these analyst numbers against your own assumptions and expectations based on your understanding of the business and what you believe is probable.
How well do narratives help inform your perspective?
Disclaimer
AnalystConsensusTarget is a tool utilizing a Large Language Model (LLM) that ingests data on consensus price targets, forecasted revenue and earnings figures, as well as the transcripts of earnings calls to produce qualitative analysis. The narratives produced by AnalystConsensusTarget are general in nature and are based solely on analyst data and publicly-available material published by the respective companies. These scenarios are not indicative of the company's future performance and are exploratory in nature. Simply Wall St has no position in the company(s) mentioned. Simply Wall St may provide the securities issuer or related entities with website advertising services for a fee, on an arm's length basis. These relationships have no impact on the way we conduct our business, the content we host, or how our content is served to users. The price targets and estimates used are consensus data, and do not constitute a recommendation to buy or sell any stock, and they do not take account of your objectives, or your financial situation. Note that AnalystConsensusTarget's analysis may not factor in the latest price-sensitive company announcements or qualitative material.