

Key Takeaways
- TMX Group's strategic expansions and acquisitions aim to drive revenue growth across new asset classes and geographies, enhancing global reach and offerings.
- Innovative trading initiatives and technology enhancements are poised to boost trading revenues and margins, supported by increased volumes and operational efficiencies.
- TMX Group faces revenue growth challenges due to reliance on acquisitions, exposure to economic risks, and increasing expenses, potentially impacting net margins.
Catalysts
About TMX Group- Operates exchanges, markets, and clearinghouses primarily for capital markets in Canada, the United States, the United Kingdom, Germany, and internationally.
- TMX Trayport's growth strategy, focused on expanding into new asset classes and geographies like climate markets, North American Power, and Japanese Power, is expected to drive future revenue increases through enhanced global reach and offerings.
- TMX VettaFi's expansion into strategic opportunities for product offerings, data, and index solutions across new asset classes and geographies suggests ongoing revenue growth, supported by increasing assets under management and synergies from recent acquisitions.
- The launch of AlphaX U.S., a new equity ATS venue, and its potential positive response could improve future trading revenues, while technology enhancements from this initiative could benefit Canadian equities trading operations, enhancing margins through improved efficiency.
- Continued strength and innovation in Derivatives Trading and Clearing, evidenced by the introduction of products like Canada's new benchmark rate CORRA, along with higher volumes and pricing changes, suggests potential growth in revenue and net margins.
- Strategic acquisitions and partnerships, as well as a focus on broadening global market presence, such as the MOU with B3 in Brazil, indicate potential future growth in revenue and enhanced earnings through diversified operations and capital offerings.
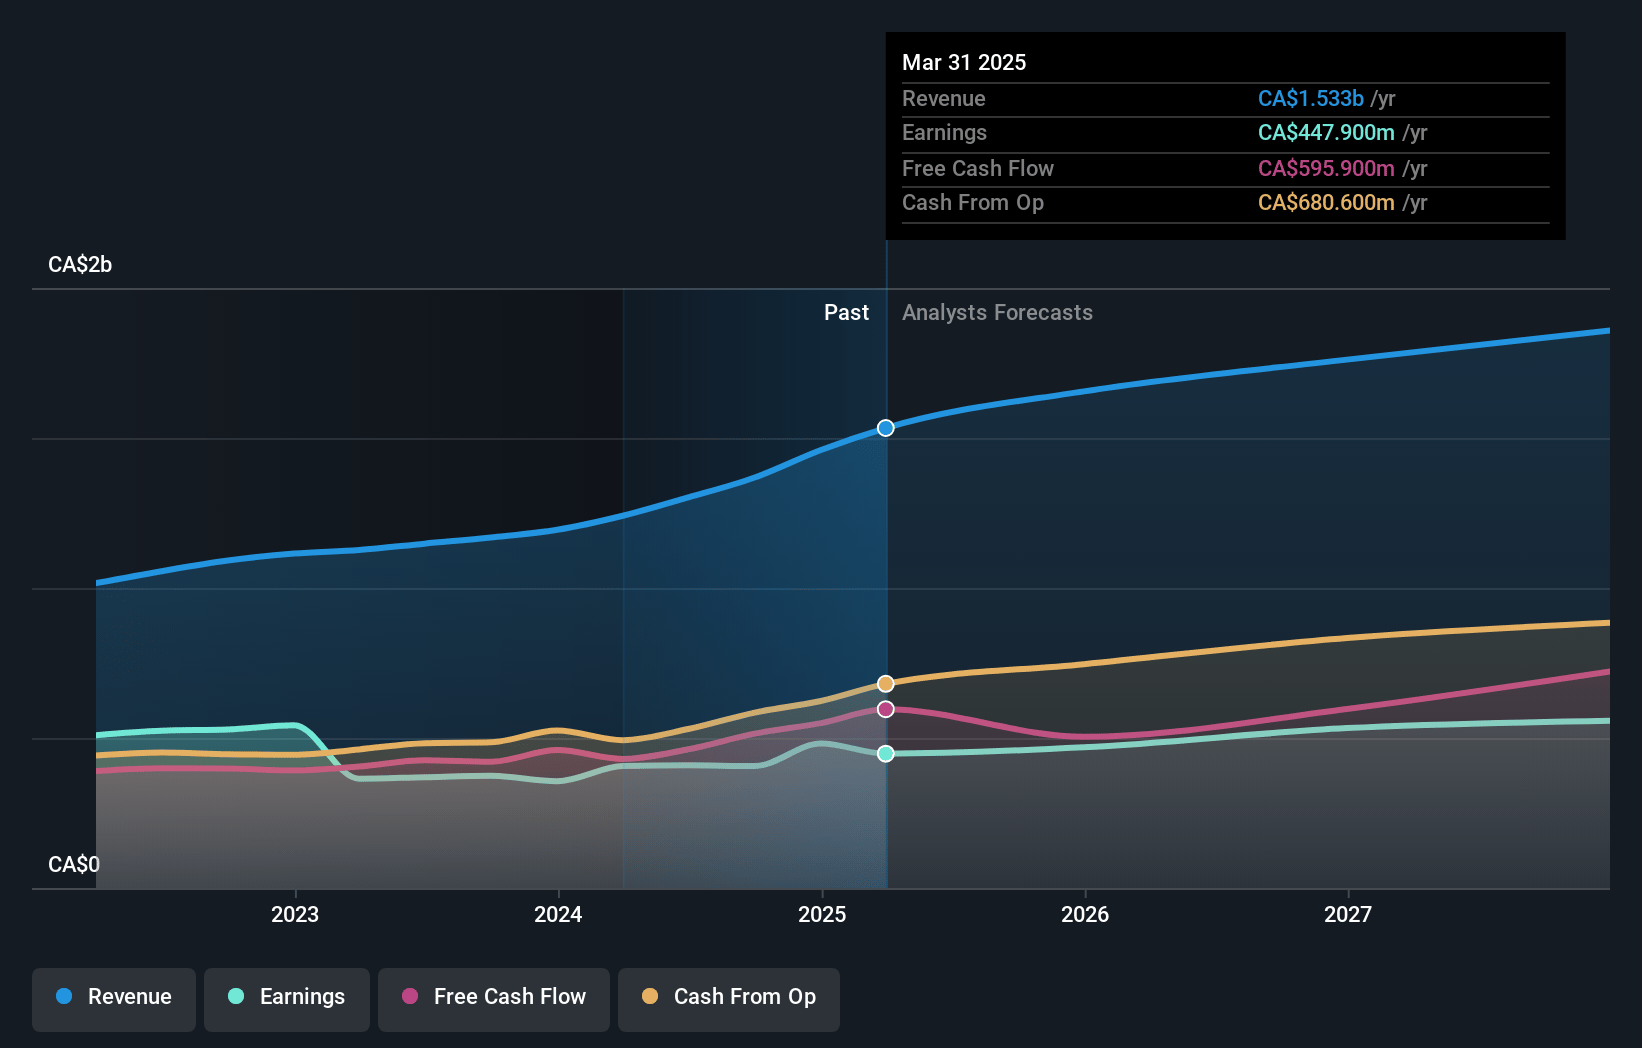
TMX Group Future Earnings and Revenue Growth
Assumptions
How have these above catalysts been quantified?- Analysts are assuming TMX Group's revenue will grow by 8.2% annually over the next 3 years.
- Analysts assume that profit margins will shrink from 33.0% today to 29.8% in 3 years time.
- Analysts expect earnings to reach CA$551.1 million (and earnings per share of CA$1.98) by about April 2028, up from CA$481.5 million today. The analysts are largely in agreement about this estimate.
- In order for the above numbers to justify the analysts price target, the company would need to trade at a PE ratio of 32.6x on those 2028 earnings, up from 29.8x today. This future PE is greater than the current PE for the CA Capital Markets industry at 11.4x.
- Analysts expect the number of shares outstanding to grow by 0.25% per year for the next 3 years.
- To value all of this in today's terms, we will use a discount rate of 6.98%, as per the Simply Wall St company report.
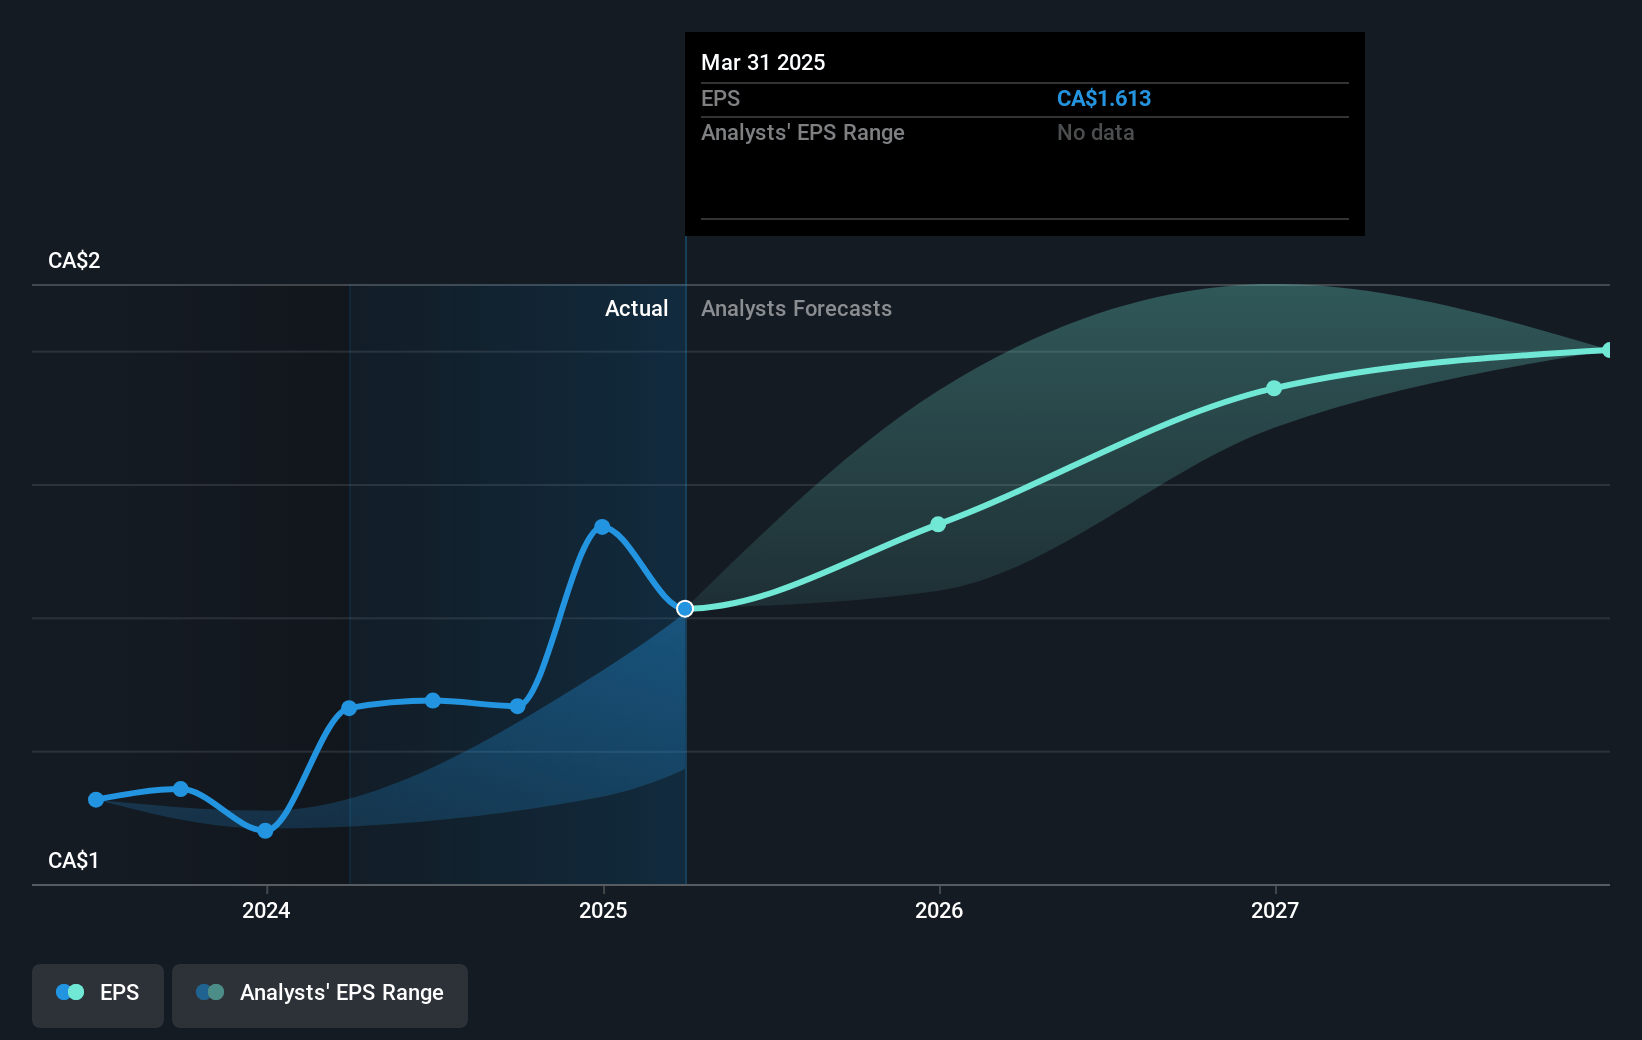
TMX Group Future Earnings Per Share Growth
Risks
What could happen that would invalidate this narrative?- The threat of tariffs and economic force from a new U.S. administration poses significant risks, which could affect cross-border revenues and the overall business environment in Canada, impacting TMX Group's future revenue streams.
- Capital Formation revenue growth was limited and heavily reliant on new acquisitions like Newsfile, indicating that without these additions, organic revenue might be under pressure, potentially impacting net margins.
- Increasing operating expenses, driven by recent acquisitions and higher costs in categories such as technology and employee incentives, might pressure net profit margins and earnings if not sufficiently offset by revenue growth.
- The dependency on factors such as currency exchange rates and interest rates introduces volatility to earnings, especially given TMX Group's exposure to global markets and foreign-denominated revenues, which could unpredictably impact net margins.
- TMX Trayport's growth strategy relies significantly on existing client expansion rather than new client acquisition, which may limit longer-term revenue growth potential if new customers are not acquired at a faster rate.
Valuation
How have all the factors above been brought together to estimate a fair value?- The analysts have a consensus price target of CA$52.375 for TMX Group based on their expectations of its future earnings growth, profit margins and other risk factors. However, there is a degree of disagreement amongst analysts, with the most bullish reporting a price target of CA$57.0, and the most bearish reporting a price target of just CA$45.0.
- In order for you to agree with the analyst's consensus, you'd need to believe that by 2028, revenues will be CA$1.8 billion, earnings will come to CA$551.1 million, and it would be trading on a PE ratio of 32.6x, assuming you use a discount rate of 7.0%.
- Given the current share price of CA$51.62, the analyst price target of CA$52.38 is 1.4% higher. The relatively low difference between the current share price and the analyst consensus price target indicates that they believe on average, the company is fairly priced.
- We always encourage you to reach your own conclusions though. So sense check these analyst numbers against your own assumptions and expectations based on your understanding of the business and what you believe is probable.
How well do narratives help inform your perspective?
Disclaimer
Warren A.I. is a tool utilizing a Large Language Model (LLM) that ingests data on consensus price targets, forecasted revenue and earnings figures, as well as the transcripts of earnings calls to produce qualitative analysis. The narratives produced by Warren A.I. are general in nature and are based solely on analyst data and publicly-available material published by the respective companies. These scenarios are not indicative of the company's future performance and are exploratory in nature. Simply Wall St has no position in the company(s) mentioned. Simply Wall St may provide the securities issuer or related entities with website advertising services for a fee, on an arm's length basis. These relationships have no impact on the way we conduct our business, the content we host, or how our content is served to users. The price targets and estimates used are consensus data, and do not constitute a recommendation to buy or sell any stock, and they do not take account of your objectives, or your financial situation. Note that Warren A.I.'s analysis may not factor in the latest price-sensitive company announcements or qualitative material.