Stock Analysis
Shareholders in Corning (NYSE:GLW) are in the red if they invested three years ago

For many investors, the main point of stock picking is to generate higher returns than the overall market. But the risk of stock picking is that you will likely buy under-performing companies. We regret to report that long term Corning Incorporated (NYSE:GLW) shareholders have had that experience, with the share price dropping 29% in three years, versus a market return of about 12%.
So let's have a look and see if the longer term performance of the company has been in line with the underlying business' progress.
See our latest analysis for Corning
In his essay The Superinvestors of Graham-and-Doddsville Warren Buffett described how share prices do not always rationally reflect the value of a business. One way to examine how market sentiment has changed over time is to look at the interaction between a company's share price and its earnings per share (EPS).
During the unfortunate three years of share price decline, Corning actually saw its earnings per share (EPS) improve by 7.7% per year. Given the share price reaction, one might suspect that EPS is not a good guide to the business performance during the period (perhaps due to a one-off loss or gain). Or else the company was over-hyped in the past, and so its growth has disappointed.
It's worth taking a look at other metrics, because the EPS growth doesn't seem to match with the falling share price.
The company has kept revenue pretty healthy over the last three years, so we doubt that explains the falling share price. We're not entirely sure why the share price is dropped, but it does seem likely investors have become less optimistic about the business.
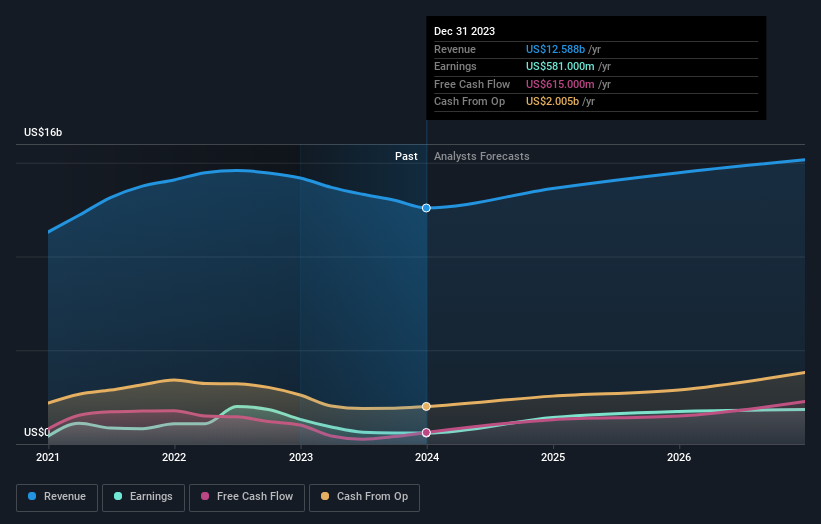
The company's revenue and earnings (over time) are depicted in the image below (click to see the exact numbers).
Corning is well known by investors, and plenty of clever analysts have tried to predict the future profit levels. So we recommend checking out this free report showing consensus forecasts
What About Dividends?
As well as measuring the share price return, investors should also consider the total shareholder return (TSR). Whereas the share price return only reflects the change in the share price, the TSR includes the value of dividends (assuming they were reinvested) and the benefit of any discounted capital raising or spin-off. It's fair to say that the TSR gives a more complete picture for stocks that pay a dividend. We note that for Corning the TSR over the last 3 years was -22%, which is better than the share price return mentioned above. And there's no prize for guessing that the dividend payments largely explain the divergence!
A Different Perspective
Investors in Corning had a tough year, with a total loss of 0.6% (including dividends), against a market gain of about 21%. Even the share prices of good stocks drop sometimes, but we want to see improvements in the fundamental metrics of a business, before getting too interested. On the bright side, long term shareholders have made money, with a gain of 3% per year over half a decade. If the fundamental data continues to indicate long term sustainable growth, the current sell-off could be an opportunity worth considering. It's always interesting to track share price performance over the longer term. But to understand Corning better, we need to consider many other factors. To that end, you should learn about the 4 warning signs we've spotted with Corning (including 1 which doesn't sit too well with us) .
For those who like to find winning investments this free list of growing companies with recent insider purchasing, could be just the ticket.
Please note, the market returns quoted in this article reflect the market weighted average returns of stocks that currently trade on American exchanges.
Valuation is complex, but we're helping make it simple.
Find out whether Corning is potentially over or undervalued by checking out our comprehensive analysis, which includes fair value estimates, risks and warnings, dividends, insider transactions and financial health.
View the Free AnalysisHave feedback on this article? Concerned about the content? Get in touch with us directly. Alternatively, email editorial-team (at) simplywallst.com.
This article by Simply Wall St is general in nature. We provide commentary based on historical data and analyst forecasts only using an unbiased methodology and our articles are not intended to be financial advice. It does not constitute a recommendation to buy or sell any stock, and does not take account of your objectives, or your financial situation. We aim to bring you long-term focused analysis driven by fundamental data. Note that our analysis may not factor in the latest price-sensitive company announcements or qualitative material. Simply Wall St has no position in any stocks mentioned.
About NYSE:GLW
Corning
Corning Incorporated engages in the display technologies, optical communications, environmental technologies, specialty materials, and life sciences businesses in the United States and internationally.
Moderate growth potential with mediocre balance sheet.
