Stock Analysis
- United States
- /
- Electronic Equipment and Components
- /
- NasdaqGS:FLEX
Flex's (NASDAQ:FLEX) earnings growth rate lags the 28% CAGR delivered to shareholders


When you buy a stock there is always a possibility that it could drop 100%. But when you pick a company that is really flourishing, you can make more than 100%. For example, the Flex Ltd. (NASDAQ:FLEX) share price has soared 152% in the last half decade. Most would be very happy with that. On top of that, the share price is up 18% in about a quarter.
Since the long term performance has been good but there's been a recent pullback of 4.6%, let's check if the fundamentals match the share price.
Check out our latest analysis for Flex
There is no denying that markets are sometimes efficient, but prices do not always reflect underlying business performance. One flawed but reasonable way to assess how sentiment around a company has changed is to compare the earnings per share (EPS) with the share price.
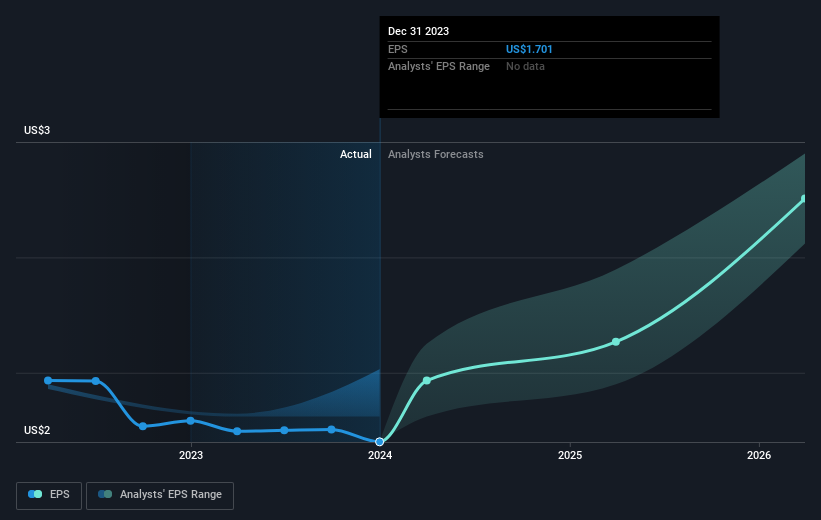
During five years of share price growth, Flex achieved compound earnings per share (EPS) growth of 47% per year. The EPS growth is more impressive than the yearly share price gain of 20% over the same period. So it seems the market isn't so enthusiastic about the stock these days.
You can see how EPS has changed over time in the image below (click on the chart to see the exact values).
It might be well worthwhile taking a look at our free report on Flex's earnings, revenue and cash flow.
What About The Total Shareholder Return (TSR)?
We've already covered Flex's share price action, but we should also mention its total shareholder return (TSR). Arguably the TSR is a more complete return calculation because it accounts for the value of dividends (as if they were reinvested), along with the hypothetical value of any discounted capital that have been offered to shareholders. We note that Flex's TSR, at 246% is higher than its share price return of 152%. When you consider it hasn't been paying a dividend, this data suggests shareholders have benefitted from a spin-off, or had the opportunity to acquire attractively priced shares in a discounted capital raising.
A Different Perspective
We're pleased to report that Flex shareholders have received a total shareholder return of 80% over one year. That gain is better than the annual TSR over five years, which is 28%. Therefore it seems like sentiment around the company has been positive lately. Someone with an optimistic perspective could view the recent improvement in TSR as indicating that the business itself is getting better with time. It's always interesting to track share price performance over the longer term. But to understand Flex better, we need to consider many other factors. Consider risks, for instance. Every company has them, and we've spotted 1 warning sign for Flex you should know about.
We will like Flex better if we see some big insider buys. While we wait, check out this free list of growing companies with considerable, recent, insider buying.
Please note, the market returns quoted in this article reflect the market weighted average returns of stocks that currently trade on American exchanges.
Valuation is complex, but we're helping make it simple.
Find out whether Flex is potentially over or undervalued by checking out our comprehensive analysis, which includes fair value estimates, risks and warnings, dividends, insider transactions and financial health.
View the Free AnalysisHave feedback on this article? Concerned about the content? Get in touch with us directly. Alternatively, email editorial-team (at) simplywallst.com.
This article by Simply Wall St is general in nature. We provide commentary based on historical data and analyst forecasts only using an unbiased methodology and our articles are not intended to be financial advice. It does not constitute a recommendation to buy or sell any stock, and does not take account of your objectives, or your financial situation. We aim to bring you long-term focused analysis driven by fundamental data. Note that our analysis may not factor in the latest price-sensitive company announcements or qualitative material. Simply Wall St has no position in any stocks mentioned.
About NasdaqGS:FLEX
Flex
Flex Ltd. provides technology, supply chain, and manufacturing solutions in Asia, the Americas, and Europe.
Flawless balance sheet and good value.
