Stock Analysis
- United States
- /
- Specialty Stores
- /
- NYSE:GPS
Even though Gap (NYSE:GPS) has lost US$418m market cap in last 7 days, shareholders are still up 116% over 1 year


The Gap, Inc. (NYSE:GPS) shareholders might be concerned after seeing the share price drop 26% in the last month. But that doesn't detract from the splendid returns of the last year. Indeed, the share price is up an impressive 106% in that time. So we think most shareholders won't be too upset about the recent fall. Investors should be wondering whether the business itself has the fundamental value required to continue to drive gains.
While this past week has detracted from the company's one-year return, let's look at the recent trends of the underlying business and see if the gains have been in alignment.
View our latest analysis for Gap
While the efficient markets hypothesis continues to be taught by some, it has been proven that markets are over-reactive dynamic systems, and investors are not always rational. One flawed but reasonable way to assess how sentiment around a company has changed is to compare the earnings per share (EPS) with the share price.
During the last year Gap grew its earnings per share, moving from a loss to a profit.
When a company has just transitioned to profitability, earnings per share growth is not always the best way to look at the share price action.
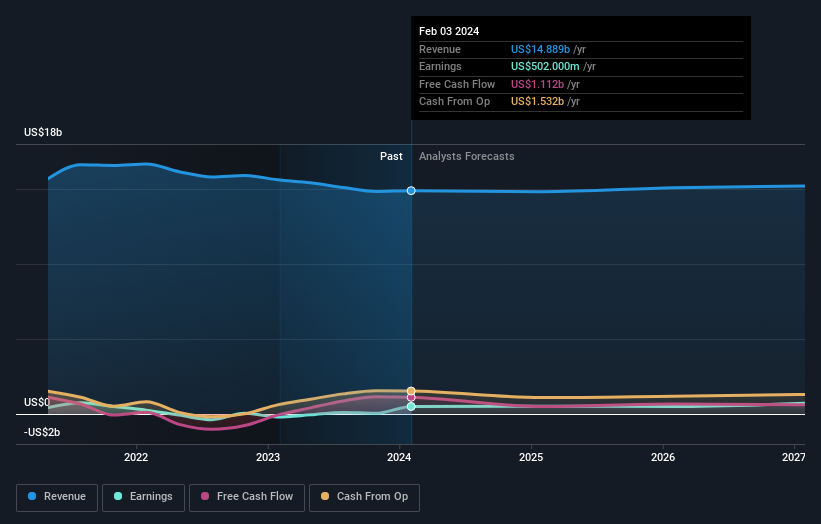
Gap's revenue actually dropped 4.6% over last year. So using a snapshot of key business metrics doesn't give us a good picture of why the market is bidding up the stock.
The image below shows how earnings and revenue have tracked over time (if you click on the image you can see greater detail).
Gap is well known by investors, and plenty of clever analysts have tried to predict the future profit levels. If you are thinking of buying or selling Gap stock, you should check out this free report showing analyst consensus estimates for future profits.
What About Dividends?
As well as measuring the share price return, investors should also consider the total shareholder return (TSR). Whereas the share price return only reflects the change in the share price, the TSR includes the value of dividends (assuming they were reinvested) and the benefit of any discounted capital raising or spin-off. So for companies that pay a generous dividend, the TSR is often a lot higher than the share price return. We note that for Gap the TSR over the last 1 year was 116%, which is better than the share price return mentioned above. And there's no prize for guessing that the dividend payments largely explain the divergence!
A Different Perspective
We're pleased to report that Gap shareholders have received a total shareholder return of 116% over one year. That's including the dividend. There's no doubt those recent returns are much better than the TSR loss of 1.0% per year over five years. The long term loss makes us cautious, but the short term TSR gain certainly hints at a brighter future. While it is well worth considering the different impacts that market conditions can have on the share price, there are other factors that are even more important. Case in point: We've spotted 1 warning sign for Gap you should be aware of.
Of course, you might find a fantastic investment by looking elsewhere. So take a peek at this free list of companies we expect will grow earnings.
Please note, the market returns quoted in this article reflect the market weighted average returns of stocks that currently trade on American exchanges.
Valuation is complex, but we're helping make it simple.
Find out whether Gap is potentially over or undervalued by checking out our comprehensive analysis, which includes fair value estimates, risks and warnings, dividends, insider transactions and financial health.
View the Free AnalysisHave feedback on this article? Concerned about the content? Get in touch with us directly. Alternatively, email editorial-team (at) simplywallst.com.
This article by Simply Wall St is general in nature. We provide commentary based on historical data and analyst forecasts only using an unbiased methodology and our articles are not intended to be financial advice. It does not constitute a recommendation to buy or sell any stock, and does not take account of your objectives, or your financial situation. We aim to bring you long-term focused analysis driven by fundamental data. Note that our analysis may not factor in the latest price-sensitive company announcements or qualitative material. Simply Wall St has no position in any stocks mentioned.
About NYSE:GPS
Adequate balance sheet and fair value.
