Stock Analysis
- United States
- /
- Real Estate
- /
- NYSE:CWK
Even after rising 4.2% this past week, Cushman & Wakefield (NYSE:CWK) shareholders are still down 51% over the past five years


We think intelligent long term investing is the way to go. But along the way some stocks are going to perform badly. To wit, the Cushman & Wakefield plc (NYSE:CWK) share price managed to fall 51% over five long years. That's an unpleasant experience for long term holders.
On a more encouraging note the company has added US$89m to its market cap in just the last 7 days, so let's see if we can determine what's driven the five-year loss for shareholders.
View our latest analysis for Cushman & Wakefield
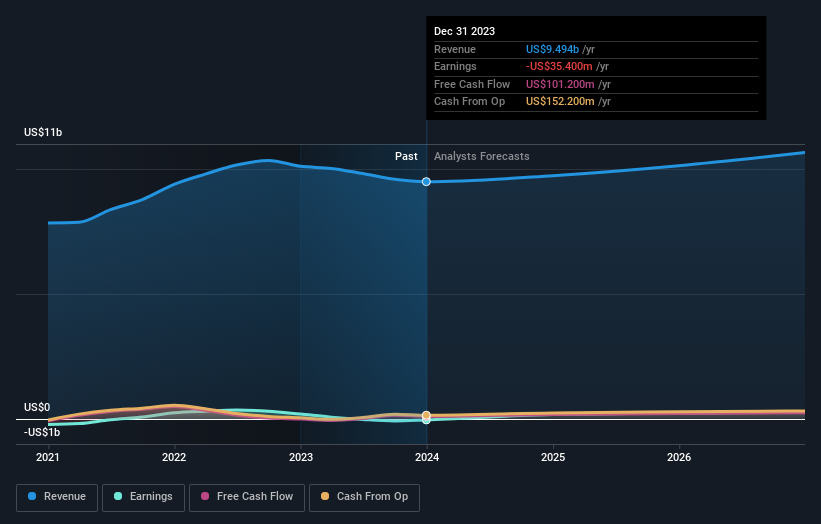
Cushman & Wakefield wasn't profitable in the last twelve months, it is unlikely we'll see a strong correlation between its share price and its earnings per share (EPS). Arguably revenue is our next best option. Generally speaking, companies without profits are expected to grow revenue every year, and at a good clip. That's because fast revenue growth can be easily extrapolated to forecast profits, often of considerable size.
Over five years, Cushman & Wakefield grew its revenue at 4.4% per year. That's not a very high growth rate considering it doesn't make profits. It's likely this weak growth has contributed to an annualised return of 9% for the last five years. We want to see an acceleration of revenue growth (or profits) before showing much interest in this one. When a stock falls hard like this, some investors like to add the company to a watchlist (in case the business recovers, longer term).
You can see how earnings and revenue have changed over time in the image below (click on the chart to see the exact values).
If you are thinking of buying or selling Cushman & Wakefield stock, you should check out this FREE detailed report on its balance sheet.
A Different Perspective
While the broader market gained around 24% in the last year, Cushman & Wakefield shareholders lost 1.3%. Even the share prices of good stocks drop sometimes, but we want to see improvements in the fundamental metrics of a business, before getting too interested. However, the loss over the last year isn't as bad as the 9% per annum loss investors have suffered over the last half decade. We'd need to see some sustained improvements in the key metrics before we could muster much enthusiasm. It's always interesting to track share price performance over the longer term. But to understand Cushman & Wakefield better, we need to consider many other factors. For instance, we've identified 1 warning sign for Cushman & Wakefield that you should be aware of.
If you like to buy stocks alongside management, then you might just love this free list of companies. (Hint: insiders have been buying them).
Please note, the market returns quoted in this article reflect the market weighted average returns of stocks that currently trade on American exchanges.
Valuation is complex, but we're helping make it simple.
Find out whether Cushman & Wakefield is potentially over or undervalued by checking out our comprehensive analysis, which includes fair value estimates, risks and warnings, dividends, insider transactions and financial health.
View the Free AnalysisHave feedback on this article? Concerned about the content? Get in touch with us directly. Alternatively, email editorial-team (at) simplywallst.com.
This article by Simply Wall St is general in nature. We provide commentary based on historical data and analyst forecasts only using an unbiased methodology and our articles are not intended to be financial advice. It does not constitute a recommendation to buy or sell any stock, and does not take account of your objectives, or your financial situation. We aim to bring you long-term focused analysis driven by fundamental data. Note that our analysis may not factor in the latest price-sensitive company announcements or qualitative material. Simply Wall St has no position in any stocks mentioned.
About NYSE:CWK
Cushman & Wakefield
Cushman & Wakefield plc, together with its subsidiaries, provides commercial real estate services under the Cushman & Wakefield brand in the United States, Australia, the United Kingdom, and internationally.
Good value with moderate growth potential.
