Stock Analysis
- United States
- /
- Entertainment
- /
- NYSE:MSGS
Madison Square Garden Sports (NYSE:MSGS) shareholders have endured a 15% loss from investing in the stock five years ago


Ideally, your overall portfolio should beat the market average. But the main game is to find enough winners to more than offset the losers At this point some shareholders may be questioning their investment in Madison Square Garden Sports Corp. (NYSE:MSGS), since the last five years saw the share price fall 42%.
Now let's have a look at the company's fundamentals, and see if the long term shareholder return has matched the performance of the underlying business.
See our latest analysis for Madison Square Garden Sports
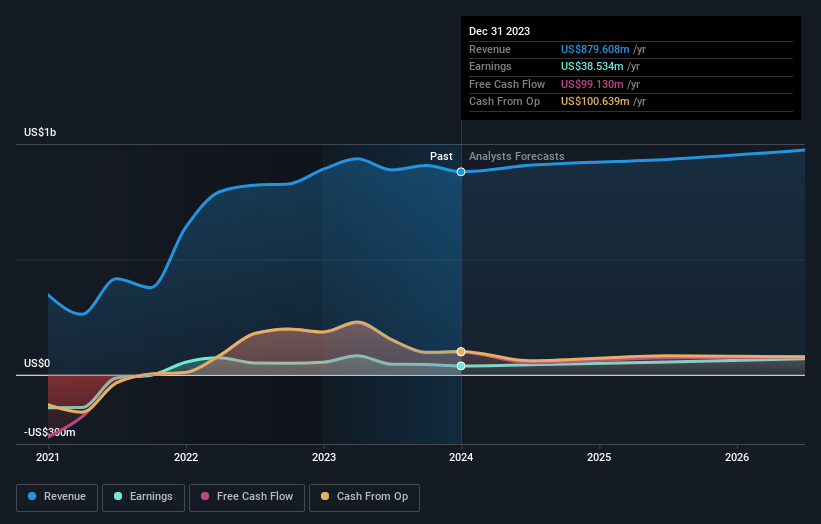
While Madison Square Garden Sports made a small profit, in the last year, we think that the market is probably more focussed on the top line growth at the moment. Generally speaking, we'd consider a stock like this alongside loss-making companies, simply because the quantum of the profit is so low. For shareholders to have confidence a company will grow profits significantly, it must grow revenue.
Over half a decade Madison Square Garden Sports reduced its trailing twelve month revenue by 0.2% for each year. That's not what investors generally want to see. The share price decline at a rate of 7% per year is disappointing. Unfortunately, though, it makes sense given the lack of either profits or revenue growth. It might be worth watching for signs of a turnaround - buyers are probably expecting one.
You can see below how earnings and revenue have changed over time (discover the exact values by clicking on the image).
It is of course excellent to see how Madison Square Garden Sports has grown profits over the years, but the future is more important for shareholders. If you are thinking of buying or selling Madison Square Garden Sports stock, you should check out this FREE detailed report on its balance sheet.
What About The Total Shareholder Return (TSR)?
We'd be remiss not to mention the difference between Madison Square Garden Sports' total shareholder return (TSR) and its share price return. Arguably the TSR is a more complete return calculation because it accounts for the value of dividends (as if they were reinvested), along with the hypothetical value of any discounted capital that have been offered to shareholders. We note that Madison Square Garden Sports' TSR, at -15% is higher than its share price return of -42%. When you consider it hasn't been paying a dividend, this data suggests shareholders have benefitted from a spin-off, or had the opportunity to acquire attractively priced shares in a discounted capital raising.
A Different Perspective
Investors in Madison Square Garden Sports had a tough year, with a total loss of 9.7%, against a market gain of about 21%. Even the share prices of good stocks drop sometimes, but we want to see improvements in the fundamental metrics of a business, before getting too interested. Unfortunately, last year's performance may indicate unresolved challenges, given that it was worse than the annualised loss of 3% over the last half decade. Generally speaking long term share price weakness can be a bad sign, though contrarian investors might want to research the stock in hope of a turnaround. It's always interesting to track share price performance over the longer term. But to understand Madison Square Garden Sports better, we need to consider many other factors. For instance, we've identified 3 warning signs for Madison Square Garden Sports (1 makes us a bit uncomfortable) that you should be aware of.
For those who like to find winning investments this free list of growing companies with recent insider purchasing, could be just the ticket.
Please note, the market returns quoted in this article reflect the market weighted average returns of stocks that currently trade on American exchanges.
Valuation is complex, but we're helping make it simple.
Find out whether Madison Square Garden Sports is potentially over or undervalued by checking out our comprehensive analysis, which includes fair value estimates, risks and warnings, dividends, insider transactions and financial health.
View the Free AnalysisHave feedback on this article? Concerned about the content? Get in touch with us directly. Alternatively, email editorial-team (at) simplywallst.com.
This article by Simply Wall St is general in nature. We provide commentary based on historical data and analyst forecasts only using an unbiased methodology and our articles are not intended to be financial advice. It does not constitute a recommendation to buy or sell any stock, and does not take account of your objectives, or your financial situation. We aim to bring you long-term focused analysis driven by fundamental data. Note that our analysis may not factor in the latest price-sensitive company announcements or qualitative material. Simply Wall St has no position in any stocks mentioned.
About NYSE:MSGS
Madison Square Garden Sports
Madison Square Garden Sports Corp. operates as a professional sports company in the United States.
Moderate growth potential and overvalued.
