Stock Analysis
- United States
- /
- Media
- /
- NasdaqGS:NXST
The total return for Nexstar Media Group (NASDAQ:NXST) investors has risen faster than earnings growth over the last five years


If you buy and hold a stock for many years, you'd hope to be making a profit. Better yet, you'd like to see the share price move up more than the market average. Unfortunately for shareholders, while the Nexstar Media Group, Inc. (NASDAQ:NXST) share price is up 39% in the last five years, that's less than the market return. Zooming in, the stock is actually down 11% in the last year.
Since the long term performance has been good but there's been a recent pullback of 4.6%, let's check if the fundamentals match the share price.
See our latest analysis for Nexstar Media Group
While markets are a powerful pricing mechanism, share prices reflect investor sentiment, not just underlying business performance. One way to examine how market sentiment has changed over time is to look at the interaction between a company's share price and its earnings per share (EPS).
Over half a decade, Nexstar Media Group managed to grow its earnings per share at 4.0% a year. This EPS growth is lower than the 7% average annual increase in the share price. So it's fair to assume the market has a higher opinion of the business than it did five years ago. That's not necessarily surprising considering the five-year track record of earnings growth.
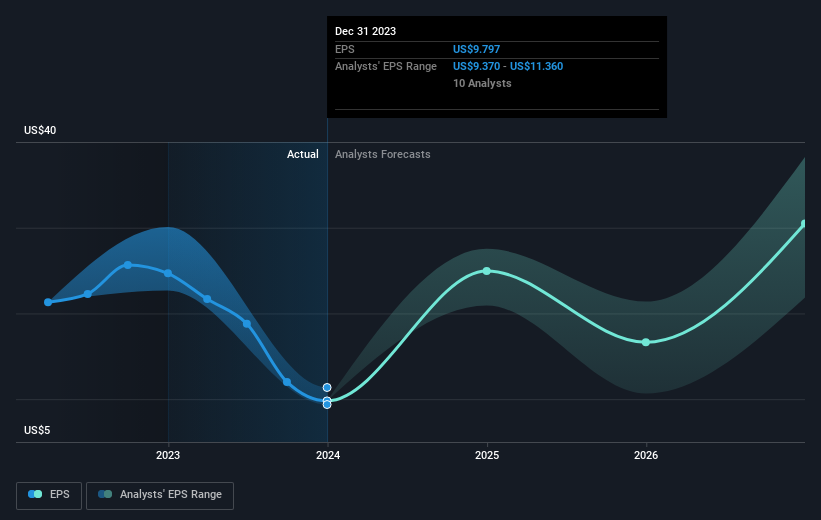
The graphic below depicts how EPS has changed over time (unveil the exact values by clicking on the image).
It might be well worthwhile taking a look at our free report on Nexstar Media Group's earnings, revenue and cash flow.
What About Dividends?
It is important to consider the total shareholder return, as well as the share price return, for any given stock. Whereas the share price return only reflects the change in the share price, the TSR includes the value of dividends (assuming they were reinvested) and the benefit of any discounted capital raising or spin-off. So for companies that pay a generous dividend, the TSR is often a lot higher than the share price return. In the case of Nexstar Media Group, it has a TSR of 57% for the last 5 years. That exceeds its share price return that we previously mentioned. The dividends paid by the company have thusly boosted the total shareholder return.
A Different Perspective
Investors in Nexstar Media Group had a tough year, with a total loss of 7.2% (including dividends), against a market gain of about 25%. Even the share prices of good stocks drop sometimes, but we want to see improvements in the fundamental metrics of a business, before getting too interested. On the bright side, long term shareholders have made money, with a gain of 9% per year over half a decade. If the fundamental data continues to indicate long term sustainable growth, the current sell-off could be an opportunity worth considering. I find it very interesting to look at share price over the long term as a proxy for business performance. But to truly gain insight, we need to consider other information, too. Take risks, for example - Nexstar Media Group has 3 warning signs (and 1 which is significant) we think you should know about.
Of course Nexstar Media Group may not be the best stock to buy. So you may wish to see this free collection of growth stocks.
Please note, the market returns quoted in this article reflect the market weighted average returns of stocks that currently trade on American exchanges.
Valuation is complex, but we're helping make it simple.
Find out whether Nexstar Media Group is potentially over or undervalued by checking out our comprehensive analysis, which includes fair value estimates, risks and warnings, dividends, insider transactions and financial health.
View the Free AnalysisHave feedback on this article? Concerned about the content? Get in touch with us directly. Alternatively, email editorial-team (at) simplywallst.com.
This article by Simply Wall St is general in nature. We provide commentary based on historical data and analyst forecasts only using an unbiased methodology and our articles are not intended to be financial advice. It does not constitute a recommendation to buy or sell any stock, and does not take account of your objectives, or your financial situation. We aim to bring you long-term focused analysis driven by fundamental data. Note that our analysis may not factor in the latest price-sensitive company announcements or qualitative material. Simply Wall St has no position in any stocks mentioned.
About NasdaqGS:NXST
Nexstar Media Group
Nexstar Media Group, Inc. operates as a diversified media company that produces and distributes engaging local and national news, sports and entertainment content across the television and digital platforms in the United States.
Established dividend payer and good value.
