Stock Analysis
- United States
- /
- Insurance
- /
- NYSE:EG
Declining Stock and Solid Fundamentals: Is The Market Wrong About Everest Group, Ltd. (NYSE:EG)?


Everest Group (NYSE:EG) has had a rough month with its share price down 7.8%. However, a closer look at its sound financials might cause you to think again. Given that fundamentals usually drive long-term market outcomes, the company is worth looking at. In this article, we decided to focus on Everest Group's ROE.
ROE or return on equity is a useful tool to assess how effectively a company can generate returns on the investment it received from its shareholders. In short, ROE shows the profit each dollar generates with respect to its shareholder investments.
Check out our latest analysis for Everest Group
How To Calculate Return On Equity?
Return on equity can be calculated by using the formula:
Return on Equity = Net Profit (from continuing operations) ÷ Shareholders' Equity
So, based on the above formula, the ROE for Everest Group is:
21% = US$2.9b ÷ US$14b (Based on the trailing twelve months to March 2024).
The 'return' is the yearly profit. That means that for every $1 worth of shareholders' equity, the company generated $0.21 in profit.
Why Is ROE Important For Earnings Growth?
So far, we've learned that ROE is a measure of a company's profitability. Based on how much of its profits the company chooses to reinvest or "retain", we are then able to evaluate a company's future ability to generate profits. Assuming all else is equal, companies that have both a higher return on equity and higher profit retention are usually the ones that have a higher growth rate when compared to companies that don't have the same features.
A Side By Side comparison of Everest Group's Earnings Growth And 21% ROE
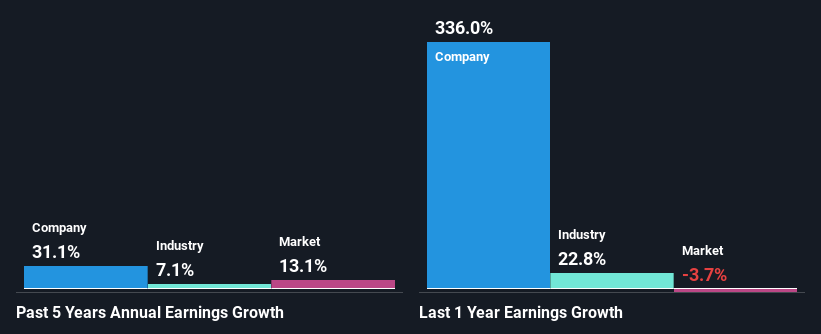
To start with, Everest Group's ROE looks acceptable. Further, the company's ROE compares quite favorably to the industry average of 13%. Probably as a result of this, Everest Group was able to see an impressive net income growth of 31% over the last five years. However, there could also be other causes behind this growth. For instance, the company has a low payout ratio or is being managed efficiently.
We then compared Everest Group's net income growth with the industry and we're pleased to see that the company's growth figure is higher when compared with the industry which has a growth rate of 7.1% in the same 5-year period.
The basis for attaching value to a company is, to a great extent, tied to its earnings growth. What investors need to determine next is if the expected earnings growth, or the lack of it, is already built into the share price. Doing so will help them establish if the stock's future looks promising or ominous. If you're wondering about Everest Group's's valuation, check out this gauge of its price-to-earnings ratio, as compared to its industry.
Is Everest Group Making Efficient Use Of Its Profits?
Everest Group's three-year median payout ratio to shareholders is 22%, which is quite low. This implies that the company is retaining 78% of its profits. This suggests that the management is reinvesting most of the profits to grow the business as evidenced by the growth seen by the company.
Besides, Everest Group has been paying dividends for at least ten years or more. This shows that the company is committed to sharing profits with its shareholders. Existing analyst estimates suggest that the company's future payout ratio is expected to drop to 11% over the next three years. However, the company's ROE is not expected to change by much despite the lower expected payout ratio.
Summary
Overall, we are quite pleased with Everest Group's performance. In particular, it's great to see that the company is investing heavily into its business and along with a high rate of return, that has resulted in a sizeable growth in its earnings. That being so, a study of the latest analyst forecasts show that the company is expected to see a slowdown in its future earnings growth. Are these analysts expectations based on the broad expectations for the industry, or on the company's fundamentals? Click here to be taken to our analyst's forecasts page for the company.
Valuation is complex, but we're helping make it simple.
Find out whether Everest Group is potentially over or undervalued by checking out our comprehensive analysis, which includes fair value estimates, risks and warnings, dividends, insider transactions and financial health.
View the Free AnalysisHave feedback on this article? Concerned about the content? Get in touch with us directly. Alternatively, email editorial-team (at) simplywallst.com.
This article by Simply Wall St is general in nature. We provide commentary based on historical data and analyst forecasts only using an unbiased methodology and our articles are not intended to be financial advice. It does not constitute a recommendation to buy or sell any stock, and does not take account of your objectives, or your financial situation. We aim to bring you long-term focused analysis driven by fundamental data. Note that our analysis may not factor in the latest price-sensitive company announcements or qualitative material. Simply Wall St has no position in any stocks mentioned.
About NYSE:EG
Everest Group
Through its subsidiaries, provides reinsurance and insurance products in the United States, Europe, and internationally.
Outstanding track record, undervalued and pays a dividend.
