- United States
- /
- Medical Equipment
- /
- NYSE:MDT
While shareholders of Medtronic (NYSE:MDT) are in the red over the last three years, underlying earnings have actually grown


Medtronic plc (NYSE:MDT) shareholders should be happy to see the share price up 10% in the last month. But that doesn't change the fact that the returns over the last three years have been less than pleasing. In fact, the share price is down 35% in the last three years, falling well short of the market return.
The recent uptick of 7.1% could be a positive sign of things to come, so let's take a look at historical fundamentals.
See our latest analysis for Medtronic
To quote Buffett, 'Ships will sail around the world but the Flat Earth Society will flourish. There will continue to be wide discrepancies between price and value in the marketplace...' One imperfect but simple way to consider how the market perception of a company has shifted is to compare the change in the earnings per share (EPS) with the share price movement.
During the unfortunate three years of share price decline, Medtronic actually saw its earnings per share (EPS) improve by 2.0% per year. This is quite a puzzle, and suggests there might be something temporarily buoying the share price. Or else the company was over-hyped in the past, and so its growth has disappointed.
After considering the numbers, we'd posit that the the market had higher expectations of EPS growth, three years back. However, taking a look at other business metrics might shed a bit more light on the share price action.
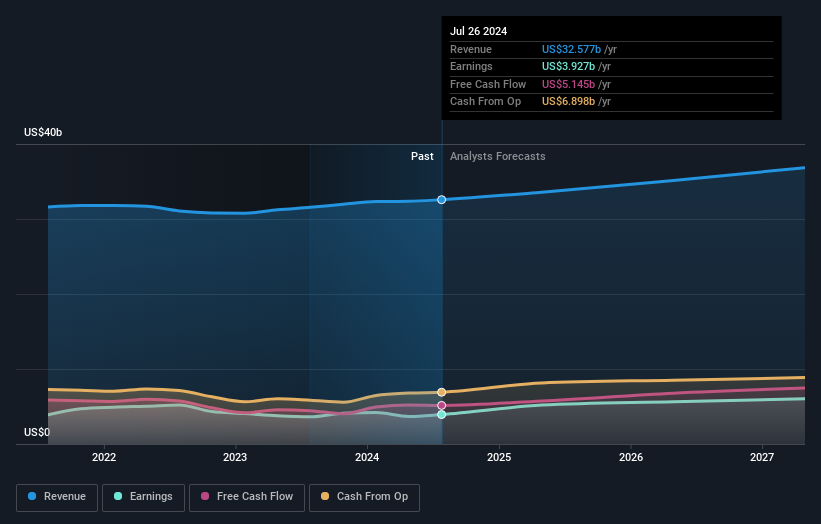
With revenue flat over three years, it seems unlikely that the share price is reflecting the top line. We're not entirely sure why the share price is dropped, but it does seem likely investors have become less optimistic about the business.
You can see how earnings and revenue have changed over time in the image below (click on the chart to see the exact values).
Medtronic is well known by investors, and plenty of clever analysts have tried to predict the future profit levels. So we recommend checking out this free report showing consensus forecasts
What About Dividends?
As well as measuring the share price return, investors should also consider the total shareholder return (TSR). Whereas the share price return only reflects the change in the share price, the TSR includes the value of dividends (assuming they were reinvested) and the benefit of any discounted capital raising or spin-off. It's fair to say that the TSR gives a more complete picture for stocks that pay a dividend. As it happens, Medtronic's TSR for the last 3 years was -29%, which exceeds the share price return mentioned earlier. And there's no prize for guessing that the dividend payments largely explain the divergence!
A Different Perspective
Medtronic provided a TSR of 8.2% over the last twelve months. But that return falls short of the market. On the bright side, that's still a gain, and it is certainly better than the yearly loss of about 1.4% endured over half a decade. So this might be a sign the business has turned its fortunes around. While it is well worth considering the different impacts that market conditions can have on the share price, there are other factors that are even more important. Take risks, for example - Medtronic has 3 warning signs we think you should be aware of.
If you would prefer to check out another company -- one with potentially superior financials -- then do not miss this free list of companies that have proven they can grow earnings.
Please note, the market returns quoted in this article reflect the market weighted average returns of stocks that currently trade on American exchanges.
New: Manage All Your Stock Portfolios in One Place
We've created the ultimate portfolio companion for stock investors, and it's free.
• Connect an unlimited number of Portfolios and see your total in one currency
• Be alerted to new Warning Signs or Risks via email or mobile
• Track the Fair Value of your stocks
Have feedback on this article? Concerned about the content? Get in touch with us directly. Alternatively, email editorial-team (at) simplywallst.com.
This article by Simply Wall St is general in nature. We provide commentary based on historical data and analyst forecasts only using an unbiased methodology and our articles are not intended to be financial advice. It does not constitute a recommendation to buy or sell any stock, and does not take account of your objectives, or your financial situation. We aim to bring you long-term focused analysis driven by fundamental data. Note that our analysis may not factor in the latest price-sensitive company announcements or qualitative material. Simply Wall St has no position in any stocks mentioned.
About NYSE:MDT
Medtronic
Develops, manufactures, and sells device-based medical therapies to healthcare systems, physicians, clinicians, and patients worldwide.
Undervalued average dividend payer.
