Stock Analysis
- United States
- /
- Food
- /
- NYSE:SJM
J. M. Smucker (NYSE:SJM) investors are sitting on a loss of 26% if they invested a year ago


Passive investing in an index fund is a good way to ensure your own returns roughly match the overall market. Active investors aim to buy stocks that vastly outperform the market - but in the process, they risk under-performance. Investors in The J. M. Smucker Company (NYSE:SJM) have tasted that bitter downside in the last year, as the share price dropped 29%. That falls noticeably short of the market return of around 27%. Longer term shareholders haven't suffered as badly, since the stock is down a comparatively less painful 16% in three years. Furthermore, it's down 14% in about a quarter. That's not much fun for holders.
It's worthwhile assessing if the company's economics have been moving in lockstep with these underwhelming shareholder returns, or if there is some disparity between the two. So let's do just that.
See our latest analysis for J. M. Smucker
There is no denying that markets are sometimes efficient, but prices do not always reflect underlying business performance. By comparing earnings per share (EPS) and share price changes over time, we can get a feel for how investor attitudes to a company have morphed over time.
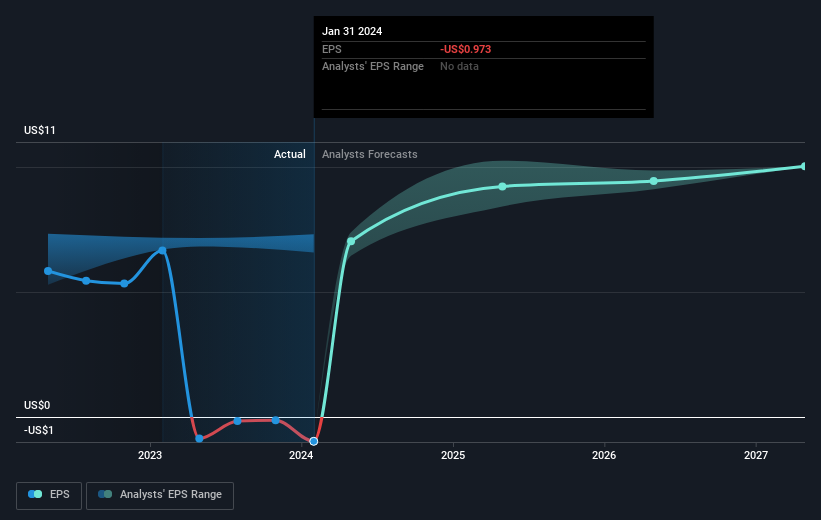
During the last year J. M. Smucker saw its earnings per share drop below zero. While this may prove temporary, we'd consider it a negative, so it doesn't surprise us that the stock price is down. Of course, if the company can turn the situation around, investors will likely profit.
You can see below how EPS has changed over time (discover the exact values by clicking on the image).
It's good to see that there was some significant insider buying in the last three months. That's a positive. That said, we think earnings and revenue growth trends are even more important factors to consider. This free interactive report on J. M. Smucker's earnings, revenue and cash flow is a great place to start, if you want to investigate the stock further.
What About Dividends?
It is important to consider the total shareholder return, as well as the share price return, for any given stock. The TSR incorporates the value of any spin-offs or discounted capital raisings, along with any dividends, based on the assumption that the dividends are reinvested. So for companies that pay a generous dividend, the TSR is often a lot higher than the share price return. In the case of J. M. Smucker, it has a TSR of -26% for the last 1 year. That exceeds its share price return that we previously mentioned. And there's no prize for guessing that the dividend payments largely explain the divergence!
A Different Perspective
While the broader market gained around 27% in the last year, J. M. Smucker shareholders lost 26% (even including dividends). Even the share prices of good stocks drop sometimes, but we want to see improvements in the fundamental metrics of a business, before getting too interested. Longer term investors wouldn't be so upset, since they would have made 0.6%, each year, over five years. It could be that the recent sell-off is an opportunity, so it may be worth checking the fundamental data for signs of a long term growth trend. I find it very interesting to look at share price over the long term as a proxy for business performance. But to truly gain insight, we need to consider other information, too. Case in point: We've spotted 3 warning signs for J. M. Smucker you should be aware of, and 1 of them doesn't sit too well with us.
J. M. Smucker is not the only stock insiders are buying. So take a peek at this free list of growing companies with insider buying.
Please note, the market returns quoted in this article reflect the market weighted average returns of stocks that currently trade on American exchanges.
Valuation is complex, but we're helping make it simple.
Find out whether J. M. Smucker is potentially over or undervalued by checking out our comprehensive analysis, which includes fair value estimates, risks and warnings, dividends, insider transactions and financial health.
View the Free AnalysisHave feedback on this article? Concerned about the content? Get in touch with us directly. Alternatively, email editorial-team (at) simplywallst.com.
This article by Simply Wall St is general in nature. We provide commentary based on historical data and analyst forecasts only using an unbiased methodology and our articles are not intended to be financial advice. It does not constitute a recommendation to buy or sell any stock, and does not take account of your objectives, or your financial situation. We aim to bring you long-term focused analysis driven by fundamental data. Note that our analysis may not factor in the latest price-sensitive company announcements or qualitative material. Simply Wall St has no position in any stocks mentioned.
About NYSE:SJM
J. M. Smucker
Manufactures and markets branded food and beverage products worldwide.
Good value average dividend payer.

