Stock Analysis
- United States
- /
- Beverage
- /
- NYSE:NAPA
The Duckhorn Portfolio, Inc. (NYSE:NAPA) Stock's Been Sliding But Fundamentals Look Decent: Will The Market Correct The Share Price In The Future?


It is hard to get excited after looking at Duckhorn Portfolio's (NYSE:NAPA) recent performance, when its stock has declined 15% over the past month. But if you pay close attention, you might find that its key financial indicators look quite decent, which could mean that the stock could potentially rise in the long-term given how markets usually reward more resilient long-term fundamentals. Specifically, we decided to study Duckhorn Portfolio's ROE in this article.
Return on equity or ROE is a key measure used to assess how efficiently a company's management is utilizing the company's capital. In other words, it is a profitability ratio which measures the rate of return on the capital provided by the company's shareholders.
See our latest analysis for Duckhorn Portfolio
How Do You Calculate Return On Equity?
The formula for ROE is:
Return on Equity = Net Profit (from continuing operations) ÷ Shareholders' Equity
So, based on the above formula, the ROE for Duckhorn Portfolio is:
6.8% = US$66m ÷ US$977m (Based on the trailing twelve months to January 2024).
The 'return' is the amount earned after tax over the last twelve months. So, this means that for every $1 of its shareholder's investments, the company generates a profit of $0.07.
What Has ROE Got To Do With Earnings Growth?
We have already established that ROE serves as an efficient profit-generating gauge for a company's future earnings. Depending on how much of these profits the company reinvests or "retains", and how effectively it does so, we are then able to assess a company’s earnings growth potential. Generally speaking, other things being equal, firms with a high return on equity and profit retention, have a higher growth rate than firms that don’t share these attributes.
Duckhorn Portfolio's Earnings Growth And 6.8% ROE
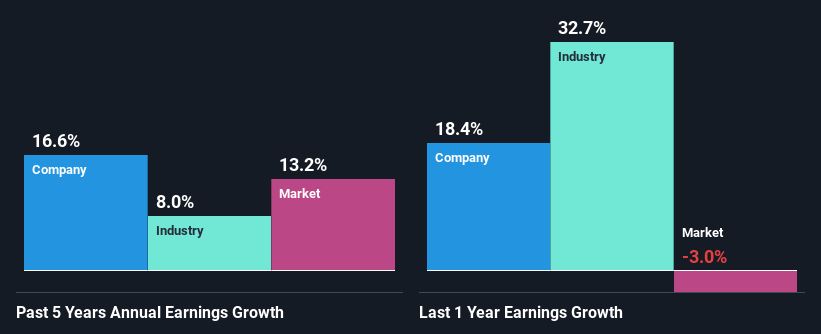
On the face of it, Duckhorn Portfolio's ROE is not much to talk about. A quick further study shows that the company's ROE doesn't compare favorably to the industry average of 19% either. Although, we can see that Duckhorn Portfolio saw a modest net income growth of 17% over the past five years. We reckon that there could be other factors at play here. For example, it is possible that the company's management has made some good strategic decisions, or that the company has a low payout ratio.
We then compared Duckhorn Portfolio's net income growth with the industry and we're pleased to see that the company's growth figure is higher when compared with the industry which has a growth rate of 8.0% in the same 5-year period.
Earnings growth is a huge factor in stock valuation. The investor should try to establish if the expected growth or decline in earnings, whichever the case may be, is priced in. This then helps them determine if the stock is placed for a bright or bleak future. Has the market priced in the future outlook for NAPA? You can find out in our latest intrinsic value infographic research report.
Is Duckhorn Portfolio Efficiently Re-investing Its Profits?
Duckhorn Portfolio doesn't pay any regular dividends, meaning that all of its profits are being reinvested in the business, which explains the fair bit of earnings growth the company has seen.
Conclusion
In total, it does look like Duckhorn Portfolio has some positive aspects to its business. With a high rate of reinvestment, albeit at a low ROE, the company has managed to see a considerable growth in its earnings. On studying current analyst estimates, we found that analysts expect the company to continue its recent growth streak. To know more about the company's future earnings growth forecasts take a look at this free report on analyst forecasts for the company to find out more.
Valuation is complex, but we're helping make it simple.
Find out whether Duckhorn Portfolio is potentially over or undervalued by checking out our comprehensive analysis, which includes fair value estimates, risks and warnings, dividends, insider transactions and financial health.
View the Free AnalysisHave feedback on this article? Concerned about the content? Get in touch with us directly. Alternatively, email editorial-team (at) simplywallst.com.
This article by Simply Wall St is general in nature. We provide commentary based on historical data and analyst forecasts only using an unbiased methodology and our articles are not intended to be financial advice. It does not constitute a recommendation to buy or sell any stock, and does not take account of your objectives, or your financial situation. We aim to bring you long-term focused analysis driven by fundamental data. Note that our analysis may not factor in the latest price-sensitive company announcements or qualitative material. Simply Wall St has no position in any stocks mentioned.
About NYSE:NAPA
Undervalued with proven track record.

