Stock Analysis
- United States
- /
- Luxury
- /
- NasdaqGS:GIII
G-III Apparel Group, Ltd.'s (NASDAQ:GIII) Stock On An Uptrend: Could Fundamentals Be Driving The Momentum?


G-III Apparel Group (NASDAQ:GIII) has had a great run on the share market with its stock up by a significant 6.5% over the last week. As most would know, fundamentals are what usually guide market price movements over the long-term, so we decided to look at the company's key financial indicators today to determine if they have any role to play in the recent price movement. Specifically, we decided to study G-III Apparel Group's ROE in this article.
Return on Equity or ROE is a test of how effectively a company is growing its value and managing investors’ money. In short, ROE shows the profit each dollar generates with respect to its shareholder investments.
See our latest analysis for G-III Apparel Group
How To Calculate Return On Equity?
The formula for ROE is:
Return on Equity = Net Profit (from continuing operations) ÷ Shareholders' Equity
So, based on the above formula, the ROE for G-III Apparel Group is:
11% = US$175m ÷ US$1.5b (Based on the trailing twelve months to January 2024).
The 'return' is the income the business earned over the last year. One way to conceptualize this is that for each $1 of shareholders' capital it has, the company made $0.11 in profit.
What Is The Relationship Between ROE And Earnings Growth?
We have already established that ROE serves as an efficient profit-generating gauge for a company's future earnings. Based on how much of its profits the company chooses to reinvest or "retain", we are then able to evaluate a company's future ability to generate profits. Generally speaking, other things being equal, firms with a high return on equity and profit retention, have a higher growth rate than firms that don’t share these attributes.
A Side By Side comparison of G-III Apparel Group's Earnings Growth And 11% ROE
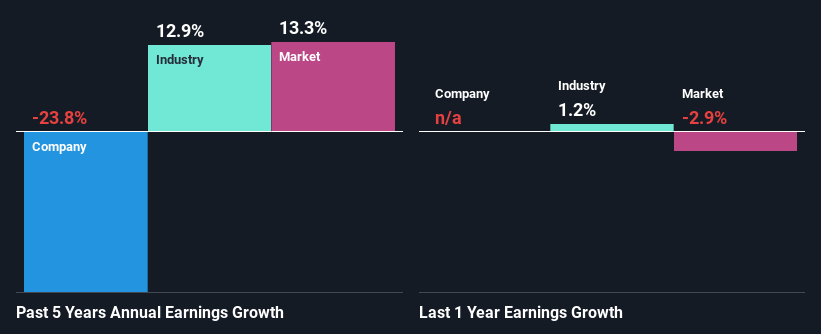
To begin with, G-III Apparel Group seems to have a respectable ROE. And on comparing with the industry, we found that the the average industry ROE is similar at 13%. As you might expect, the 24% net income decline reported by G-III Apparel Group is a bit of a surprise. We reckon that there could be some other factors at play here that are preventing the company's growth. For example, it could be that the company has a high payout ratio or the business has allocated capital poorly, for instance.
So, as a next step, we compared G-III Apparel Group's performance against the industry and were disappointed to discover that while the company has been shrinking its earnings, the industry has been growing its earnings at a rate of 13% over the last few years.
Earnings growth is a huge factor in stock valuation. The investor should try to establish if the expected growth or decline in earnings, whichever the case may be, is priced in. This then helps them determine if the stock is placed for a bright or bleak future. One good indicator of expected earnings growth is the P/E ratio which determines the price the market is willing to pay for a stock based on its earnings prospects. So, you may want to check if G-III Apparel Group is trading on a high P/E or a low P/E, relative to its industry.
Is G-III Apparel Group Making Efficient Use Of Its Profits?
G-III Apparel Group doesn't pay any regular dividends, meaning that the company is keeping all of its profits, which makes us wonder why it is retaining its earnings if it can't use them to grow its business. So there could be some other explanations in that regard. For instance, the company's business may be deteriorating.
Summary
In total, it does look like G-III Apparel Group has some positive aspects to its business. Although, we are disappointed to see a lack of growth in earnings even in spite of a high ROE and and a high reinvestment rate. We believe that there might be some outside factors that could be having a negative impact on the business. While we won't completely dismiss the company, what we would do, is try to ascertain how risky the business is to make a more informed decision around the company. To know the 1 risk we have identified for G-III Apparel Group visit our risks dashboard for free.
Valuation is complex, but we're helping make it simple.
Find out whether G-III Apparel Group is potentially over or undervalued by checking out our comprehensive analysis, which includes fair value estimates, risks and warnings, dividends, insider transactions and financial health.
View the Free AnalysisHave feedback on this article? Concerned about the content? Get in touch with us directly. Alternatively, email editorial-team (at) simplywallst.com.
This article by Simply Wall St is general in nature. We provide commentary based on historical data and analyst forecasts only using an unbiased methodology and our articles are not intended to be financial advice. It does not constitute a recommendation to buy or sell any stock, and does not take account of your objectives, or your financial situation. We aim to bring you long-term focused analysis driven by fundamental data. Note that our analysis may not factor in the latest price-sensitive company announcements or qualitative material. Simply Wall St has no position in any stocks mentioned.
About NasdaqGS:GIII
G-III Apparel Group
G-III Apparel Group, Ltd. designs, sources, and markets women’s and men’s apparel in the United States and internationally.
Flawless balance sheet and slightly overvalued.
