Stock Analysis
- United States
- /
- Construction
- /
- NYSE:EME
Are Strong Financial Prospects The Force That Is Driving The Momentum In EMCOR Group, Inc.'s NYSE:EME) Stock?


Most readers would already be aware that EMCOR Group's (NYSE:EME) stock increased significantly by 53% over the past three months. Given the company's impressive performance, we decided to study its financial indicators more closely as a company's financial health over the long-term usually dictates market outcomes. Specifically, we decided to study EMCOR Group's ROE in this article.
Return on Equity or ROE is a test of how effectively a company is growing its value and managing investors’ money. In simpler terms, it measures the profitability of a company in relation to shareholder's equity.
Check out our latest analysis for EMCOR Group
How Do You Calculate Return On Equity?
The formula for ROE is:
Return on Equity = Net Profit (from continuing operations) ÷ Shareholders' Equity
So, based on the above formula, the ROE for EMCOR Group is:
26% = US$633m ÷ US$2.5b (Based on the trailing twelve months to December 2023).
The 'return' refers to a company's earnings over the last year. One way to conceptualize this is that for each $1 of shareholders' capital it has, the company made $0.26 in profit.
Why Is ROE Important For Earnings Growth?
So far, we've learned that ROE is a measure of a company's profitability. We now need to evaluate how much profit the company reinvests or "retains" for future growth which then gives us an idea about the growth potential of the company. Generally speaking, other things being equal, firms with a high return on equity and profit retention, have a higher growth rate than firms that don’t share these attributes.
A Side By Side comparison of EMCOR Group's Earnings Growth And 26% ROE
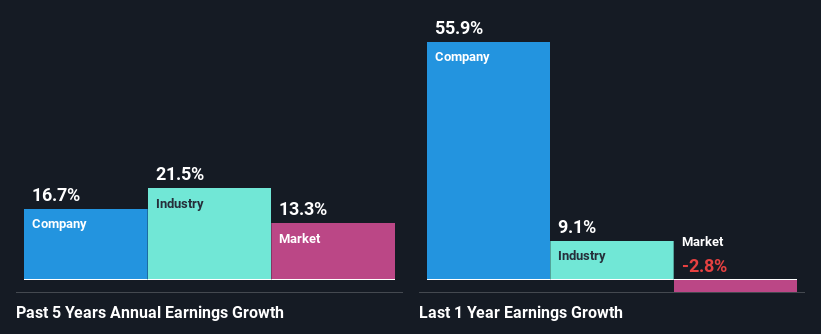
First thing first, we like that EMCOR Group has an impressive ROE. Additionally, the company's ROE is higher compared to the industry average of 12% which is quite remarkable. This probably laid the groundwork for EMCOR Group's moderate 17% net income growth seen over the past five years.
We then compared EMCOR Group's net income growth with the industry and found that the company's growth figure is lower than the average industry growth rate of 22% in the same 5-year period, which is a bit concerning.
Earnings growth is an important metric to consider when valuing a stock. What investors need to determine next is if the expected earnings growth, or the lack of it, is already built into the share price. This then helps them determine if the stock is placed for a bright or bleak future. Is EME fairly valued? This infographic on the company's intrinsic value has everything you need to know.
Is EMCOR Group Efficiently Re-investing Its Profits?
EMCOR Group has a low three-year median payout ratio of 7.1%, meaning that the company retains the remaining 93% of its profits. This suggests that the management is reinvesting most of the profits to grow the business.
Moreover, EMCOR Group is determined to keep sharing its profits with shareholders which we infer from its long history of paying a dividend for at least ten years. Upon studying the latest analysts' consensus data, we found that the company's future payout ratio is expected to drop to 4.4% over the next three years.
Conclusion
Overall, we are quite pleased with EMCOR Group's performance. Specifically, we like that the company is reinvesting a huge chunk of its profits at a high rate of return. This of course has caused the company to see a good amount of growth in its earnings. That being so, a study of the latest analyst forecasts show that the company is expected to see a slowdown in its future earnings growth. To know more about the company's future earnings growth forecasts take a look at this free report on analyst forecasts for the company to find out more.
Valuation is complex, but we're helping make it simple.
Find out whether EMCOR Group is potentially over or undervalued by checking out our comprehensive analysis, which includes fair value estimates, risks and warnings, dividends, insider transactions and financial health.
View the Free AnalysisHave feedback on this article? Concerned about the content? Get in touch with us directly. Alternatively, email editorial-team (at) simplywallst.com.
This article by Simply Wall St is general in nature. We provide commentary based on historical data and analyst forecasts only using an unbiased methodology and our articles are not intended to be financial advice. It does not constitute a recommendation to buy or sell any stock, and does not take account of your objectives, or your financial situation. We aim to bring you long-term focused analysis driven by fundamental data. Note that our analysis may not factor in the latest price-sensitive company announcements or qualitative material. Simply Wall St has no position in any stocks mentioned.
About NYSE:EME
EMCOR Group
EMCOR Group, Inc. provides construction and facilities, building, and industrial services in the United States and the United Kingdom.
Outstanding track record with flawless balance sheet.
