Stock Analysis
- United States
- /
- Banks
- /
- NasdaqGS:CASH
Pathward Financial's (NASDAQ:CASH) five-year earnings growth trails the 16% YoY shareholder returns


The worst result, after buying shares in a company (assuming no leverage), would be if you lose all the money you put in. But on the bright side, if you buy shares in a high quality company at the right price, you can gain well over 100%. For example, the Pathward Financial, Inc. (NASDAQ:CASH) share price has soared 101% in the last half decade. Most would be very happy with that. It's even up 4.6% in the last week.
Since the stock has added US$57m to its market cap in the past week alone, let's see if underlying performance has been driving long-term returns.
See our latest analysis for Pathward Financial
While markets are a powerful pricing mechanism, share prices reflect investor sentiment, not just underlying business performance. One flawed but reasonable way to assess how sentiment around a company has changed is to compare the earnings per share (EPS) with the share price.
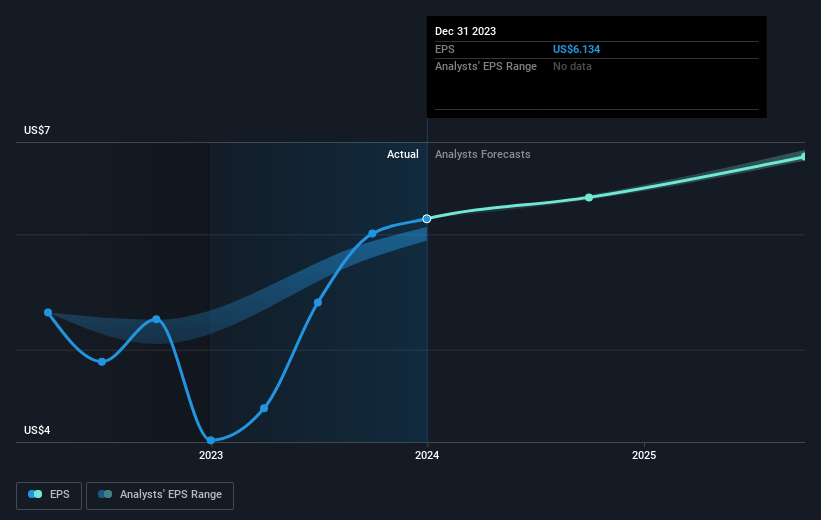
Over half a decade, Pathward Financial managed to grow its earnings per share at 28% a year. This EPS growth is higher than the 15% average annual increase in the share price. So it seems the market isn't so enthusiastic about the stock these days. This cautious sentiment is reflected in its (fairly low) P/E ratio of 8.03.
You can see how EPS has changed over time in the image below (click on the chart to see the exact values).
We know that Pathward Financial has improved its bottom line lately, but is it going to grow revenue? Check if analysts think Pathward Financial will grow revenue in the future.
What About Dividends?
It is important to consider the total shareholder return, as well as the share price return, for any given stock. The TSR incorporates the value of any spin-offs or discounted capital raisings, along with any dividends, based on the assumption that the dividends are reinvested. So for companies that pay a generous dividend, the TSR is often a lot higher than the share price return. As it happens, Pathward Financial's TSR for the last 5 years was 107%, which exceeds the share price return mentioned earlier. The dividends paid by the company have thusly boosted the total shareholder return.
A Different Perspective
Pathward Financial provided a TSR of 25% over the year (including dividends). That's fairly close to the broader market return. That gain looks pretty satisfying, and it is even better than the five-year TSR of 16% per year. It is possible that management foresight will bring growth well into the future, even if the share price slows down. While it is well worth considering the different impacts that market conditions can have on the share price, there are other factors that are even more important. For instance, we've identified 1 warning sign for Pathward Financial that you should be aware of.
If you are like me, then you will not want to miss this free list of growing companies that insiders are buying.
Please note, the market returns quoted in this article reflect the market weighted average returns of stocks that currently trade on American exchanges.
Valuation is complex, but we're helping make it simple.
Find out whether Pathward Financial is potentially over or undervalued by checking out our comprehensive analysis, which includes fair value estimates, risks and warnings, dividends, insider transactions and financial health.
View the Free AnalysisHave feedback on this article? Concerned about the content? Get in touch with us directly. Alternatively, email editorial-team (at) simplywallst.com.
This article by Simply Wall St is general in nature. We provide commentary based on historical data and analyst forecasts only using an unbiased methodology and our articles are not intended to be financial advice. It does not constitute a recommendation to buy or sell any stock, and does not take account of your objectives, or your financial situation. We aim to bring you long-term focused analysis driven by fundamental data. Note that our analysis may not factor in the latest price-sensitive company announcements or qualitative material. Simply Wall St has no position in any stocks mentioned.
About NasdaqGS:CASH
Pathward Financial
Pathward Financial, Inc. operates as the bank holding company for Pathward, National Association that provides various banking products and services in the United States.
Outstanding track record with flawless balance sheet.
