Stock Analysis
- United States
- /
- Auto Components
- /
- NasdaqGS:DORM
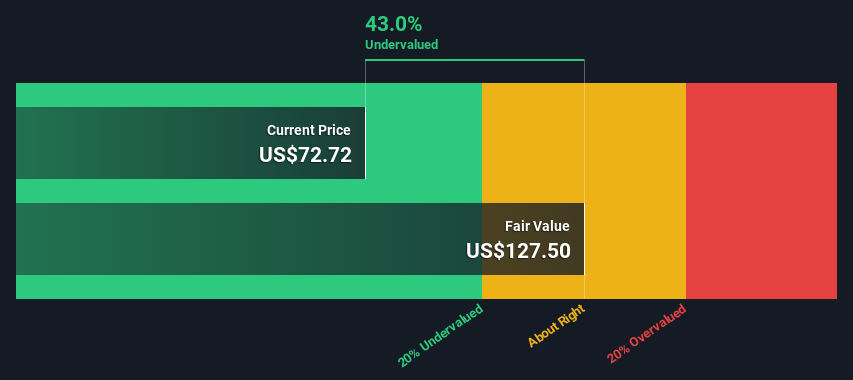
An Intrinsic Calculation For Dorman Products, Inc. (NASDAQ:DORM) Suggests It's 43% Undervalued


Key Insights
- Using the 2 Stage Free Cash Flow to Equity, Dorman Products fair value estimate is US$127
- Dorman Products' US$72.72 share price signals that it might be 43% undervalued
- The US$82.00 analyst price target for DORM is 36% less than our estimate of fair value
Today we will run through one way of estimating the intrinsic value of Dorman Products, Inc. (NASDAQ:DORM) by taking the expected future cash flows and discounting them to today's value. We will use the Discounted Cash Flow (DCF) model on this occasion. It may sound complicated, but actually it is quite simple!
Companies can be valued in a lot of ways, so we would point out that a DCF is not perfect for every situation. If you want to learn more about discounted cash flow, the rationale behind this calculation can be read in detail in the Simply Wall St analysis model.
View our latest analysis for Dorman Products
The Calculation
We use what is known as a 2-stage model, which simply means we have two different periods of growth rates for the company's cash flows. Generally the first stage is higher growth, and the second stage is a lower growth phase. In the first stage we need to estimate the cash flows to the business over the next ten years. Seeing as no analyst estimates of free cash flow are available to us, we have extrapolate the previous free cash flow (FCF) from the company's last reported value. We assume companies with shrinking free cash flow will slow their rate of shrinkage, and that companies with growing free cash flow will see their growth rate slow, over this period. We do this to reflect that growth tends to slow more in the early years than it does in later years.
A DCF is all about the idea that a dollar in the future is less valuable than a dollar today, and so the sum of these future cash flows is then discounted to today's value:
10-year free cash flow (FCF) forecast
| 2024 | 2025 | 2026 | 2027 | 2028 | 2029 | 2030 | 2031 | 2032 | 2033 | |
| Levered FCF ($, Millions) | US$164.7m | US$204.4m | US$240.2m | US$271.2m | US$297.6m | US$319.8m | US$338.7m | US$354.9m | US$369.2m | US$382.0m |
| Growth Rate Estimate Source | Est @ 33.44% | Est @ 24.07% | Est @ 17.52% | Est @ 12.93% | Est @ 9.71% | Est @ 7.47% | Est @ 5.89% | Est @ 4.79% | Est @ 4.02% | Est @ 3.48% |
| Present Value ($, Millions) Discounted @ 9.3% | US$151 | US$171 | US$184 | US$190 | US$191 | US$187 | US$182 | US$174 | US$166 | US$157 |
("Est" = FCF growth rate estimated by Simply Wall St)
Present Value of 10-year Cash Flow (PVCF) = US$1.8b
The second stage is also known as Terminal Value, this is the business's cash flow after the first stage. The Gordon Growth formula is used to calculate Terminal Value at a future annual growth rate equal to the 5-year average of the 10-year government bond yield of 2.2%. We discount the terminal cash flows to today's value at a cost of equity of 9.3%.
Terminal Value (TV)= FCF2033 × (1 + g) ÷ (r – g) = US$382m× (1 + 2.2%) ÷ (9.3%– 2.2%) = US$5.5b
Present Value of Terminal Value (PVTV)= TV / (1 + r)10= US$5.5b÷ ( 1 + 9.3%)10= US$2.3b
The total value, or equity value, is then the sum of the present value of the future cash flows, which in this case is US$4.0b. The last step is to then divide the equity value by the number of shares outstanding. Relative to the current share price of US$72.7, the company appears quite good value at a 43% discount to where the stock price trades currently. Valuations are imprecise instruments though, rather like a telescope - move a few degrees and end up in a different galaxy. Do keep this in mind.
The Assumptions
The calculation above is very dependent on two assumptions. The first is the discount rate and the other is the cash flows. You don't have to agree with these inputs, I recommend redoing the calculations yourself and playing with them. The DCF also does not consider the possible cyclicality of an industry, or a company's future capital requirements, so it does not give a full picture of a company's potential performance. Given that we are looking at Dorman Products as potential shareholders, the cost of equity is used as the discount rate, rather than the cost of capital (or weighted average cost of capital, WACC) which accounts for debt. In this calculation we've used 9.3%, which is based on a levered beta of 1.418. Beta is a measure of a stock's volatility, compared to the market as a whole. We get our beta from the industry average beta of globally comparable companies, with an imposed limit between 0.8 and 2.0, which is a reasonable range for a stable business.
SWOT Analysis for Dorman Products
- Debt is well covered by earnings and cashflows.
- Earnings declined over the past year.
- Trading below our estimate of fair value by more than 20%.
- Annual revenue is forecast to grow slower than the American market.
Moving On:
Whilst important, the DCF calculation ideally won't be the sole piece of analysis you scrutinize for a company. The DCF model is not a perfect stock valuation tool. Instead the best use for a DCF model is to test certain assumptions and theories to see if they would lead to the company being undervalued or overvalued. If a company grows at a different rate, or if its cost of equity or risk free rate changes sharply, the output can look very different. What is the reason for the share price sitting below the intrinsic value? For Dorman Products, we've put together three important items you should further research:
- Risks: For example, we've discovered 2 warning signs for Dorman Products that you should be aware of before investing here.
- Management:Have insiders been ramping up their shares to take advantage of the market's sentiment for DORM's future outlook? Check out our management and board analysis with insights on CEO compensation and governance factors.
- Other Solid Businesses: Low debt, high returns on equity and good past performance are fundamental to a strong business. Why not explore our interactive list of stocks with solid business fundamentals to see if there are other companies you may not have considered!
PS. The Simply Wall St app conducts a discounted cash flow valuation for every stock on the NASDAQGS every day. If you want to find the calculation for other stocks just search here.
Valuation is complex, but we're helping make it simple.
Find out whether Dorman Products is potentially over or undervalued by checking out our comprehensive analysis, which includes fair value estimates, risks and warnings, dividends, insider transactions and financial health.
View the Free AnalysisHave feedback on this article? Concerned about the content? Get in touch with us directly. Alternatively, email editorial-team (at) simplywallst.com.
This article by Simply Wall St is general in nature. We provide commentary based on historical data and analyst forecasts only using an unbiased methodology and our articles are not intended to be financial advice. It does not constitute a recommendation to buy or sell any stock, and does not take account of your objectives, or your financial situation. We aim to bring you long-term focused analysis driven by fundamental data. Note that our analysis may not factor in the latest price-sensitive company announcements or qualitative material. Simply Wall St has no position in any stocks mentioned.
About NasdaqGS:DORM
Dorman Products
Dorman Products, Inc. supplies replacement and upgrade parts for passenger cars, light trucks, medium- and heavy-duty trucks, utility terrain vehicles, and all-terrain vehicles in the motor vehicle aftermarket industry in the United States and internationally.
Adequate balance sheet with acceptable track record.
