Stock Analysis
- Taiwan
- /
- Capital Markets
- /
- TWSE:2889
Investors more bullish on IBF Financial Holdings (TWSE:2889) this week as stock rallies 3.7%, despite earnings trending downwards over past five years


The main point of investing for the long term is to make money. Better yet, you'd like to see the share price move up more than the market average. Unfortunately for shareholders, while the IBF Financial Holdings Co., Ltd. (TWSE:2889) share price is up 50% in the last five years, that's less than the market return. Looking at the last year alone, the stock is up 14%.
The past week has proven to be lucrative for IBF Financial Holdings investors, so let's see if fundamentals drove the company's five-year performance.
View our latest analysis for IBF Financial Holdings
To paraphrase Benjamin Graham: Over the short term the market is a voting machine, but over the long term it's a weighing machine. One imperfect but simple way to consider how the market perception of a company has shifted is to compare the change in the earnings per share (EPS) with the share price movement.
IBF Financial Holdings' earnings per share are down 2.1% per year, despite strong share price performance over five years.
By glancing at these numbers, we'd posit that the decline in earnings per share is not representative of how the business has changed over the years. Therefore, it's worth taking a look at other metrics to try to understand the share price movements.
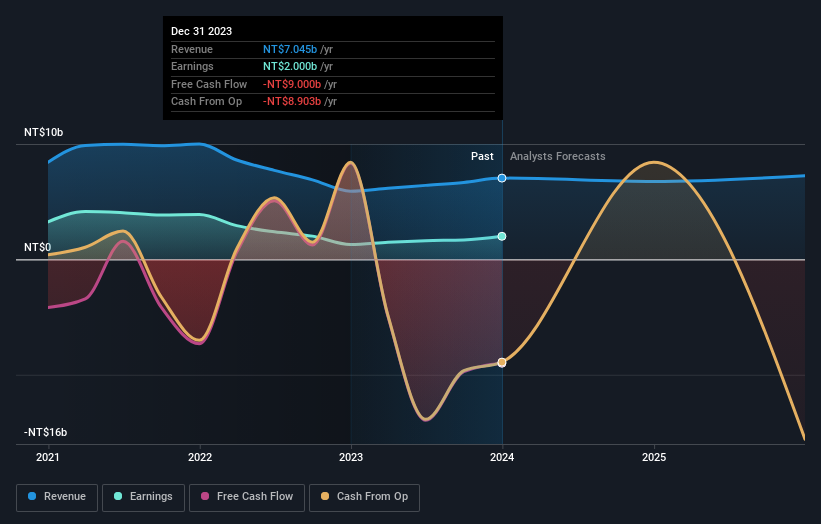
There's no sign of growing dividends, which might have explained the resilient share price. Five-year revenue growth isn't impressive. It may be that a closer look at revenue trends can explain the share price.
The company's revenue and earnings (over time) are depicted in the image below (click to see the exact numbers).
We know that IBF Financial Holdings has improved its bottom line lately, but what does the future have in store? So we recommend checking out this free report showing consensus forecasts
What About Dividends?
When looking at investment returns, it is important to consider the difference between total shareholder return (TSR) and share price return. Whereas the share price return only reflects the change in the share price, the TSR includes the value of dividends (assuming they were reinvested) and the benefit of any discounted capital raising or spin-off. It's fair to say that the TSR gives a more complete picture for stocks that pay a dividend. In the case of IBF Financial Holdings, it has a TSR of 81% for the last 5 years. That exceeds its share price return that we previously mentioned. The dividends paid by the company have thusly boosted the total shareholder return.
A Different Perspective
IBF Financial Holdings provided a TSR of 14% over the last twelve months. Unfortunately this falls short of the market return. The silver lining is that the gain was actually better than the average annual return of 13% per year over five year. It is possible that returns will improve along with the business fundamentals. I find it very interesting to look at share price over the long term as a proxy for business performance. But to truly gain insight, we need to consider other information, too. Even so, be aware that IBF Financial Holdings is showing 3 warning signs in our investment analysis , you should know about...
Of course IBF Financial Holdings may not be the best stock to buy. So you may wish to see this free collection of growth stocks.
Please note, the market returns quoted in this article reflect the market weighted average returns of stocks that currently trade on Taiwanese exchanges.
Valuation is complex, but we're helping make it simple.
Find out whether IBF Financial Holdings is potentially over or undervalued by checking out our comprehensive analysis, which includes fair value estimates, risks and warnings, dividends, insider transactions and financial health.
View the Free AnalysisHave feedback on this article? Concerned about the content? Get in touch with us directly. Alternatively, email editorial-team (at) simplywallst.com.
This article by Simply Wall St is general in nature. We provide commentary based on historical data and analyst forecasts only using an unbiased methodology and our articles are not intended to be financial advice. It does not constitute a recommendation to buy or sell any stock, and does not take account of your objectives, or your financial situation. We aim to bring you long-term focused analysis driven by fundamental data. Note that our analysis may not factor in the latest price-sensitive company announcements or qualitative material. Simply Wall St has no position in any stocks mentioned.
About TWSE:2889
IBF Financial Holdings
IBF Financial Holdings Co., Ltd., through its subsidiaries, provides various financial products and services for individual and corporate clients primarily in Taiwan.
Acceptable track record second-rate dividend payer.
