Stock Analysis
- Singapore
- /
- Real Estate
- /
- SGX:Z25
Investors five-year losses continue as Yanlord Land Group (SGX:Z25) dips a further 8.7% this week, earnings continue to decline


Statistically speaking, long term investing is a profitable endeavour. But unfortunately, some companies simply don't succeed. For example the Yanlord Land Group Limited (SGX:Z25) share price dropped 66% over five years. That is extremely sub-optimal, to say the least. And some of the more recent buyers are probably worried, too, with the stock falling 57% in the last year. Furthermore, it's down 19% in about a quarter. That's not much fun for holders.
With the stock having lost 8.7% in the past week, it's worth taking a look at business performance and seeing if there's any red flags.
See our latest analysis for Yanlord Land Group
While markets are a powerful pricing mechanism, share prices reflect investor sentiment, not just underlying business performance. One way to examine how market sentiment has changed over time is to look at the interaction between a company's share price and its earnings per share (EPS).
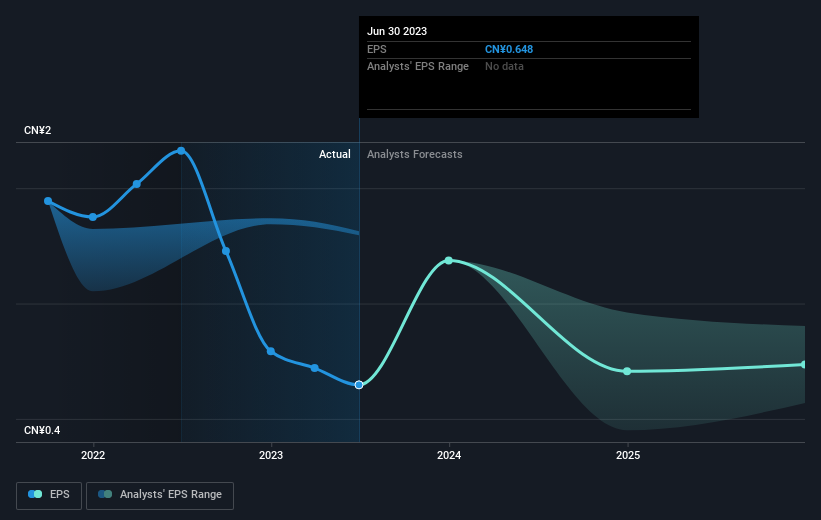
Looking back five years, both Yanlord Land Group's share price and EPS declined; the latter at a rate of 21% per year. Notably, the share price has fallen at 19% per year, fairly close to the change in the EPS. That suggests that the market sentiment around the company hasn't changed much over that time. Rather, the share price change has reflected changes in earnings per share.
You can see how EPS has changed over time in the image below (click on the chart to see the exact values).
This free interactive report on Yanlord Land Group's earnings, revenue and cash flow is a great place to start, if you want to investigate the stock further.
A Dividend Lost
The value of past dividends are accounted for in the total shareholder return (TSR), but not in the share price return mentioned above. Many would argue the TSR gives a more complete picture of the value a stock brings to its holders. Yanlord Land Group's TSR over the last 5 years is -58%; better than its share price return. Although the company had to cut dividends, it has paid cash to shareholders in the past.
A Different Perspective
While the broader market lost about 4.3% in the twelve months, Yanlord Land Group shareholders did even worse, losing 57%. Having said that, it's inevitable that some stocks will be oversold in a falling market. The key is to keep your eyes on the fundamental developments. Regrettably, last year's performance caps off a bad run, with the shareholders facing a total loss of 10% per year over five years. Generally speaking long term share price weakness can be a bad sign, though contrarian investors might want to research the stock in hope of a turnaround. While it is well worth considering the different impacts that market conditions can have on the share price, there are other factors that are even more important. Consider risks, for instance. Every company has them, and we've spotted 2 warning signs for Yanlord Land Group you should know about.
If you would prefer to check out another company -- one with potentially superior financials -- then do not miss this free list of companies that have proven they can grow earnings.
Please note, the market returns quoted in this article reflect the market weighted average returns of stocks that currently trade on Singaporean exchanges.
Valuation is complex, but we're helping make it simple.
Find out whether Yanlord Land Group is potentially over or undervalued by checking out our comprehensive analysis, which includes fair value estimates, risks and warnings, dividends, insider transactions and financial health.
View the Free AnalysisHave feedback on this article? Concerned about the content? Get in touch with us directly. Alternatively, email editorial-team (at) simplywallst.com.
This article by Simply Wall St is general in nature. We provide commentary based on historical data and analyst forecasts only using an unbiased methodology and our articles are not intended to be financial advice. It does not constitute a recommendation to buy or sell any stock, and does not take account of your objectives, or your financial situation. We aim to bring you long-term focused analysis driven by fundamental data. Note that our analysis may not factor in the latest price-sensitive company announcements or qualitative material. Simply Wall St has no position in any stocks mentioned.
About SGX:Z25
Yanlord Land Group
An investment holding company, operates as a real estate developer in the People's Republic of China, Singapore, and Hong Kong.
Adequate balance sheet and fair value.

