Stock Analysis
- Singapore
- /
- Real Estate
- /
- SGX:OU8
The 50% return delivered to Centurion's (SGX:OU8) shareholders actually lagged YoY earnings growth


One simple way to benefit from the stock market is to buy an index fund. But if you pick the right individual stocks, you could make more than that. For example, the Centurion Corporation Limited (SGX:OU8) share price is up 41% in the last three years, clearly besting the market decline of around 12% (not including dividends).
Since the stock has added S$38m to its market cap in the past week alone, let's see if underlying performance has been driving long-term returns.
See our latest analysis for Centurion
To quote Buffett, 'Ships will sail around the world but the Flat Earth Society will flourish. There will continue to be wide discrepancies between price and value in the marketplace...' One imperfect but simple way to consider how the market perception of a company has shifted is to compare the change in the earnings per share (EPS) with the share price movement.
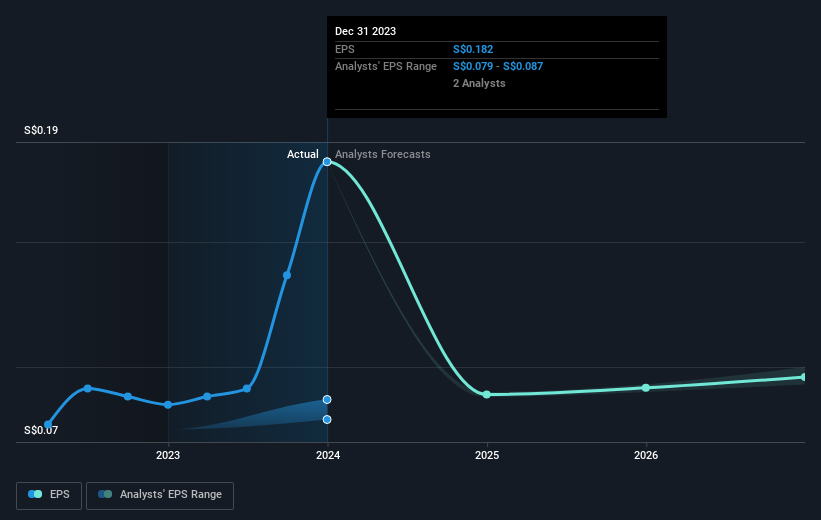
Centurion was able to grow its EPS at 107% per year over three years, sending the share price higher. This EPS growth is higher than the 12% average annual increase in the share price. So one could reasonably conclude that the market has cooled on the stock. We'd venture the lowish P/E ratio of 2.66 also reflects the negative sentiment around the stock.
The image below shows how EPS has tracked over time (if you click on the image you can see greater detail).
It's good to see that there was some significant insider buying in the last three months. That's a positive. That said, we think earnings and revenue growth trends are even more important factors to consider. Dive deeper into the earnings by checking this interactive graph of Centurion's earnings, revenue and cash flow.
What About Dividends?
When looking at investment returns, it is important to consider the difference between total shareholder return (TSR) and share price return. The TSR is a return calculation that accounts for the value of cash dividends (assuming that any dividend received was reinvested) and the calculated value of any discounted capital raisings and spin-offs. So for companies that pay a generous dividend, the TSR is often a lot higher than the share price return. We note that for Centurion the TSR over the last 3 years was 50%, which is better than the share price return mentioned above. The dividends paid by the company have thusly boosted the total shareholder return.
A Different Perspective
It's nice to see that Centurion shareholders have received a total shareholder return of 40% over the last year. That's including the dividend. That's better than the annualised return of 5% over half a decade, implying that the company is doing better recently. Someone with an optimistic perspective could view the recent improvement in TSR as indicating that the business itself is getting better with time. It's always interesting to track share price performance over the longer term. But to understand Centurion better, we need to consider many other factors. Like risks, for instance. Every company has them, and we've spotted 4 warning signs for Centurion (of which 2 make us uncomfortable!) you should know about.
Centurion is not the only stock insiders are buying. So take a peek at this free list of growing companies with insider buying.
Please note, the market returns quoted in this article reflect the market weighted average returns of stocks that currently trade on Singaporean exchanges.
Valuation is complex, but we're helping make it simple.
Find out whether Centurion is potentially over or undervalued by checking out our comprehensive analysis, which includes fair value estimates, risks and warnings, dividends, insider transactions and financial health.
View the Free AnalysisHave feedback on this article? Concerned about the content? Get in touch with us directly. Alternatively, email editorial-team (at) simplywallst.com.
This article by Simply Wall St is general in nature. We provide commentary based on historical data and analyst forecasts only using an unbiased methodology and our articles are not intended to be financial advice. It does not constitute a recommendation to buy or sell any stock, and does not take account of your objectives, or your financial situation. We aim to bring you long-term focused analysis driven by fundamental data. Note that our analysis may not factor in the latest price-sensitive company announcements or qualitative material. Simply Wall St has no position in any stocks mentioned.
About SGX:OU8
Centurion
Centurion Corporation Limited, an investment holding company, owns, develops, and manages workers and student accommodation assets in Singapore, Malaysia, Australia, the United Kingdom, and internationally.
Very undervalued with solid track record and pays a dividend.
