Stock Analysis
Is The Market Rewarding Krynica Vitamin S.A. (WSE:KVT) With A Negative Sentiment As A Result Of Its Mixed Fundamentals?


With its stock down 18% over the past three months, it is easy to disregard Krynica Vitamin (WSE:KVT). We, however decided to study the company's financials to determine if they have got anything to do with the price decline. Stock prices are usually driven by a company’s financial performance over the long term, and therefore we decided to pay more attention to the company's financial performance. In this article, we decided to focus on Krynica Vitamin's ROE.
Return on equity or ROE is a key measure used to assess how efficiently a company's management is utilizing the company's capital. Put another way, it reveals the company's success at turning shareholder investments into profits.
View our latest analysis for Krynica Vitamin
How Do You Calculate Return On Equity?
Return on equity can be calculated by using the formula:
Return on Equity = Net Profit (from continuing operations) ÷ Shareholders' Equity
So, based on the above formula, the ROE for Krynica Vitamin is:
9.2% = zł8.8m ÷ zł95m (Based on the trailing twelve months to September 2023).
The 'return' is the profit over the last twelve months. So, this means that for every PLN1 of its shareholder's investments, the company generates a profit of PLN0.09.
Why Is ROE Important For Earnings Growth?
We have already established that ROE serves as an efficient profit-generating gauge for a company's future earnings. Based on how much of its profits the company chooses to reinvest or "retain", we are then able to evaluate a company's future ability to generate profits. Generally speaking, other things being equal, firms with a high return on equity and profit retention, have a higher growth rate than firms that don’t share these attributes.
A Side By Side comparison of Krynica Vitamin's Earnings Growth And 9.2% ROE
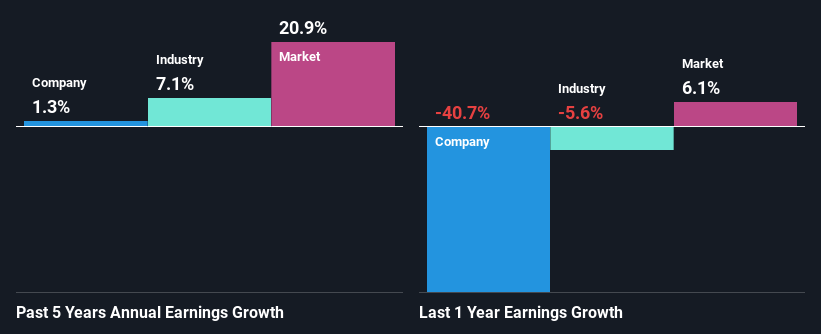
On the face of it, Krynica Vitamin's ROE is not much to talk about. Yet, a closer study shows that the company's ROE is similar to the industry average of 10%. Having said that, Krynica Vitamin's net income growth over the past five years is more or less flat. Remember, the company's ROE is not particularly great to begin with. Hence, this provides some context to the flat earnings growth seen by the company.
As a next step, we compared Krynica Vitamin's net income growth with the industry and were disappointed to see that the company's growth is lower than the industry average growth of 7.1% in the same period.
Earnings growth is a huge factor in stock valuation. The investor should try to establish if the expected growth or decline in earnings, whichever the case may be, is priced in. By doing so, they will have an idea if the stock is headed into clear blue waters or if swampy waters await. If you're wondering about Krynica Vitamin's's valuation, check out this gauge of its price-to-earnings ratio, as compared to its industry.
Is Krynica Vitamin Using Its Retained Earnings Effectively?
In spite of a normal three-year median payout ratio of 27% (or a retention ratio of 73%), Krynica Vitamin hasn't seen much growth in its earnings. So there might be other factors at play here which could potentially be hampering growth. For example, the business has faced some headwinds.
In addition, Krynica Vitamin has been paying dividends over a period of eight years suggesting that keeping up dividend payments is way more important to the management even if it comes at the cost of business growth.
Summary
On the whole, we feel that the performance shown by Krynica Vitamin can be open to many interpretations. While the company does have a high rate of reinvestment, the low ROE means that all that reinvestment is not reaping any benefit to its investors, and moreover, its having a negative impact on the earnings growth. Until now, we have only just grazed the surface of the company's past performance by looking at the company's fundamentals. So it may be worth checking this free detailed graph of Krynica Vitamin's past earnings, as well as revenue and cash flows to get a deeper insight into the company's performance.
Valuation is complex, but we're helping make it simple.
Find out whether Krynica Vitamin is potentially over or undervalued by checking out our comprehensive analysis, which includes fair value estimates, risks and warnings, dividends, insider transactions and financial health.
View the Free AnalysisHave feedback on this article? Concerned about the content? Get in touch with us directly. Alternatively, email editorial-team (at) simplywallst.com.
This article by Simply Wall St is general in nature. We provide commentary based on historical data and analyst forecasts only using an unbiased methodology and our articles are not intended to be financial advice. It does not constitute a recommendation to buy or sell any stock, and does not take account of your objectives, or your financial situation. We aim to bring you long-term focused analysis driven by fundamental data. Note that our analysis may not factor in the latest price-sensitive company announcements or qualitative material. Simply Wall St has no position in any stocks mentioned.
About WSE:KVT
Krynica Vitamin
Krynica Vitamin S.A. produces and sells non-alcoholic and low-alcoholic beverages in Poland, Germany, the United Kingdom, the Czech Republic, Slovakia, and internationally.
Adequate balance sheet and fair value.
