Stock Analysis
- Norway
- /
- Industrials
- /
- OB:AKER
There's Been No Shortage Of Growth Recently For Aker's (OB:AKER) Returns On Capital

There are a few key trends to look for if we want to identify the next multi-bagger. In a perfect world, we'd like to see a company investing more capital into its business and ideally the returns earned from that capital are also increasing. This shows us that it's a compounding machine, able to continually reinvest its earnings back into the business and generate higher returns. With that in mind, we've noticed some promising trends at Aker (OB:AKER) so let's look a bit deeper.
Return On Capital Employed (ROCE): What Is It?
Just to clarify if you're unsure, ROCE is a metric for evaluating how much pre-tax income (in percentage terms) a company earns on the capital invested in its business. Analysts use this formula to calculate it for Aker:
Return on Capital Employed = Earnings Before Interest and Tax (EBIT) ÷ (Total Assets - Current Liabilities)
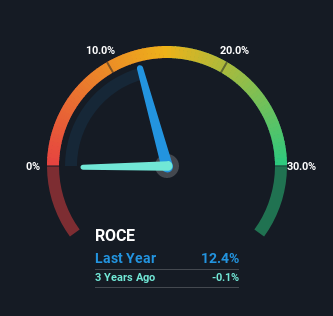
0.12 = kr11b ÷ (kr97b - kr10b) (Based on the trailing twelve months to December 2022).
Therefore, Aker has an ROCE of 12%. In absolute terms, that's a satisfactory return, but compared to the Industrials industry average of 8.4% it's much better.
See our latest analysis for Aker
While the past is not representative of the future, it can be helpful to know how a company has performed historically, which is why we have this chart above. If you want to delve into the historical earnings, revenue and cash flow of Aker, check out these free graphs here.
So How Is Aker's ROCE Trending?
Aker is displaying some positive trends. The numbers show that in the last five years, the returns generated on capital employed have grown considerably to 12%. Basically the business is earning more per dollar of capital invested and in addition to that, 31% more capital is being employed now too. This can indicate that there's plenty of opportunities to invest capital internally and at ever higher rates, a combination that's common among multi-baggers.
One more thing to note, Aker has decreased current liabilities to 11% of total assets over this period, which effectively reduces the amount of funding from suppliers or short-term creditors. So this improvement in ROCE has come from the business' underlying economics, which is great to see.
The Key Takeaway
In summary, it's great to see that Aker can compound returns by consistently reinvesting capital at increasing rates of return, because these are some of the key ingredients of those highly sought after multi-baggers. Since the stock has only returned 21% to shareholders over the last five years, the promising fundamentals may not be recognized yet by investors. Given that, we'd look further into this stock in case it has more traits that could make it multiply in the long term.
Since virtually every company faces some risks, it's worth knowing what they are, and we've spotted 2 warning signs for Aker (of which 1 is concerning!) that you should know about.
While Aker may not currently earn the highest returns, we've compiled a list of companies that currently earn more than 25% return on equity. Check out this free list here.
Valuation is complex, but we're helping make it simple.
Find out whether Aker is potentially over or undervalued by checking out our comprehensive analysis, which includes fair value estimates, risks and warnings, dividends, insider transactions and financial health.
View the Free AnalysisHave feedback on this article? Concerned about the content? Get in touch with us directly. Alternatively, email editorial-team (at) simplywallst.com.
This article by Simply Wall St is general in nature. We provide commentary based on historical data and analyst forecasts only using an unbiased methodology and our articles are not intended to be financial advice. It does not constitute a recommendation to buy or sell any stock, and does not take account of your objectives, or your financial situation. We aim to bring you long-term focused analysis driven by fundamental data. Note that our analysis may not factor in the latest price-sensitive company announcements or qualitative material. Simply Wall St has no position in any stocks mentioned.
About OB:AKER
Aker
Aker ASA operates as an industrial investment company in Norway, the European Union, North America, South America, Asia, and internationally.
Fair value second-rate dividend payer.
