Stock Analysis
- Netherlands
- /
- Professional Services
- /
- ENXTAM:RAND
Three High Yield Dividend Stocks On Euronext Amsterdam With Up To 4.7% Yield

Reviewed by Simply Wall St

Amid a backdrop of cautious optimism in European markets, where recent ECB statements have tempered expectations for aggressive monetary easing, investors continue to seek stable returns. In this environment, high-yield dividend stocks listed on Euronext Amsterdam present an appealing option for those looking to balance yield with potential market volatility.
Top 5 Dividend Stocks In The Netherlands
| Name | Dividend Yield | Dividend Rating |
| Acomo (ENXTAM:ACOMO) | 6.61% | ★★★★★☆ |
| ABN AMRO Bank (ENXTAM:ABN) | 9.57% | ★★★★☆☆ |
| Randstad (ENXTAM:RAND) | 4.54% | ★★★★☆☆ |
| Koninklijke KPN (ENXTAM:KPN) | 4.37% | ★★★★☆☆ |
| Koninklijke Heijmans (ENXTAM:HEIJM) | 4.73% | ★★★★☆☆ |
Below we spotlight a couple of our favorites from our exclusive screener.
Koninklijke Heijmans (ENXTAM:HEIJM)
Simply Wall St Dividend Rating: ★★★★☆☆
Overview: Koninklijke Heijmans N.V. operates in property development, construction, and infrastructure sectors primarily in the Netherlands and abroad, with a market capitalization of approximately €504.33 million.
Operations: Koninklijke Heijmans N.V. generates revenue through its segments: Real Estate (€411.79 million), Van Wanrooij (€124.76 million), Infrastructure Works (€800.03 million), and Construction & Technology (€1.08 billion).
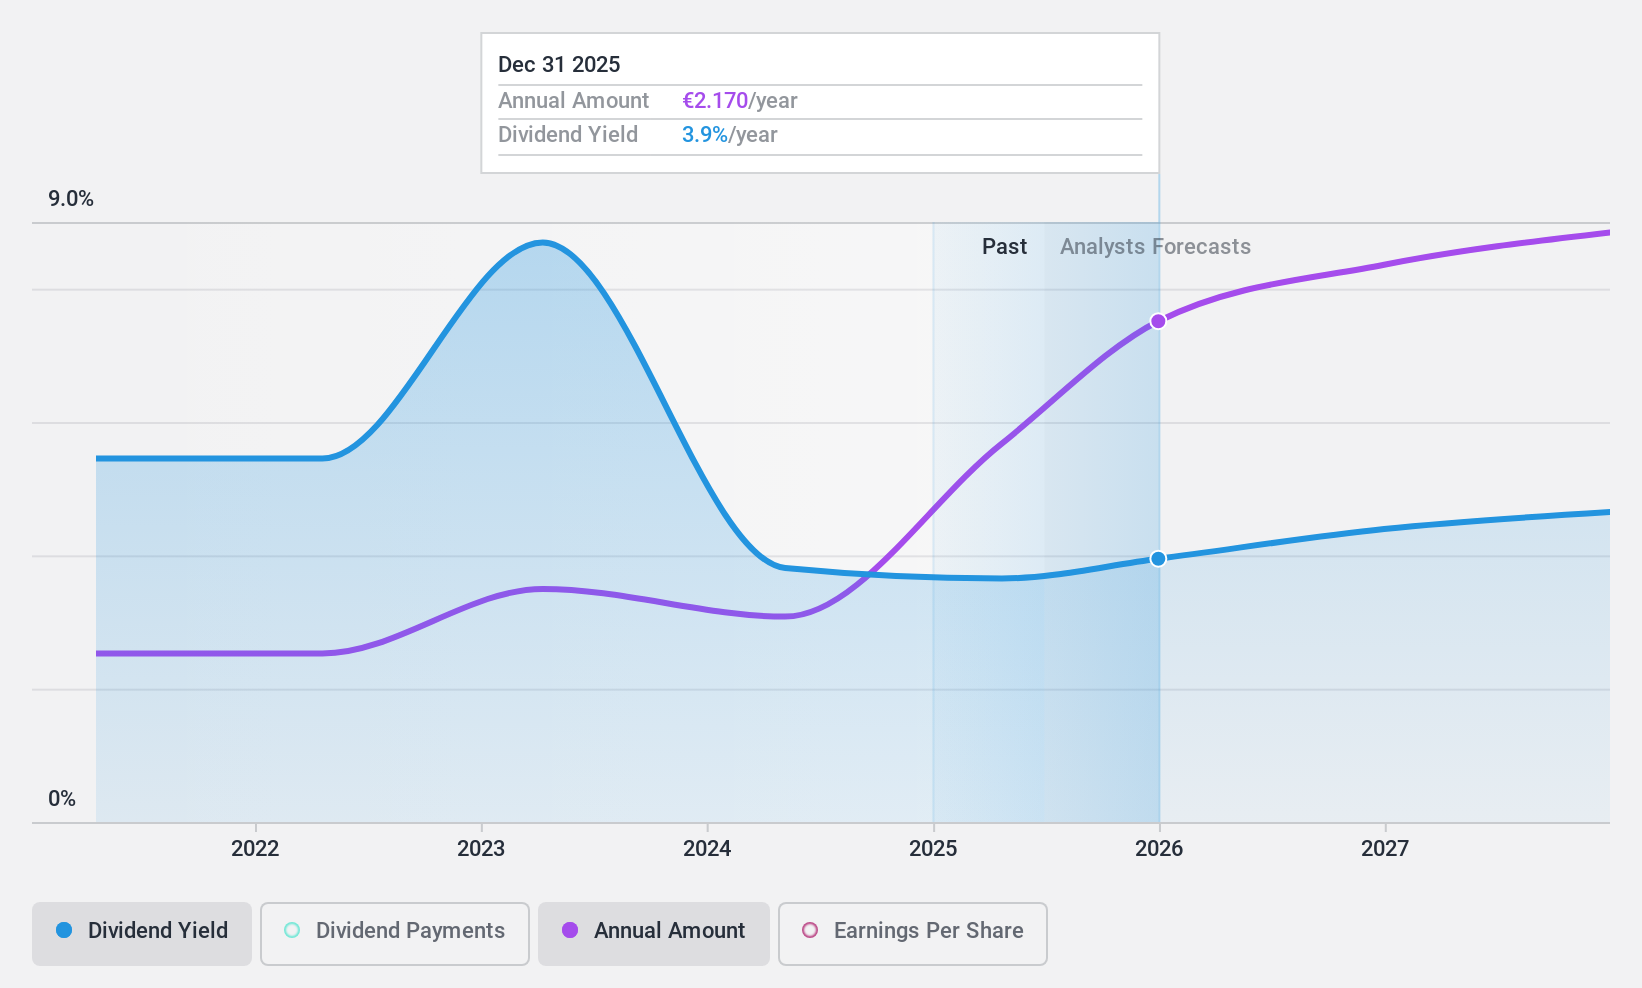
Dividend Yield: 4.7%
Koninklijke Heijmans has shown earnings growth of 19.4% annually over the past five years, with dividends well-covered by earnings (37.1% payout ratio) and cash flows (59% cash payout ratio). However, its dividend track record has been unstable, with significant volatility and irregular increases over the past decade. Despite trading below fair value by 12.2%, its dividend yield at 4.73% remains below the top quartile in the Dutch market. Recent financials reveal stable year-over-year net income with sales increasing to €2.12 billion from €1.81 billion.
- Unlock comprehensive insights into our analysis of Koninklijke Heijmans stock in this dividend report.
- The valuation report we've compiled suggests that Koninklijke Heijmans' current price could be quite moderate.
Koninklijke KPN (ENXTAM:KPN)
Simply Wall St Dividend Rating: ★★★★☆☆
Overview: Koninklijke KPN N.V. is a telecommunications and IT service provider in the Netherlands, with a market capitalization of approximately €13.49 billion.
Operations: Koninklijke KPN N.V. generates its revenue primarily from three segments: Consumer (€2.93 billion), Business (€1.84 billion), and Wholesale (€0.70 billion).
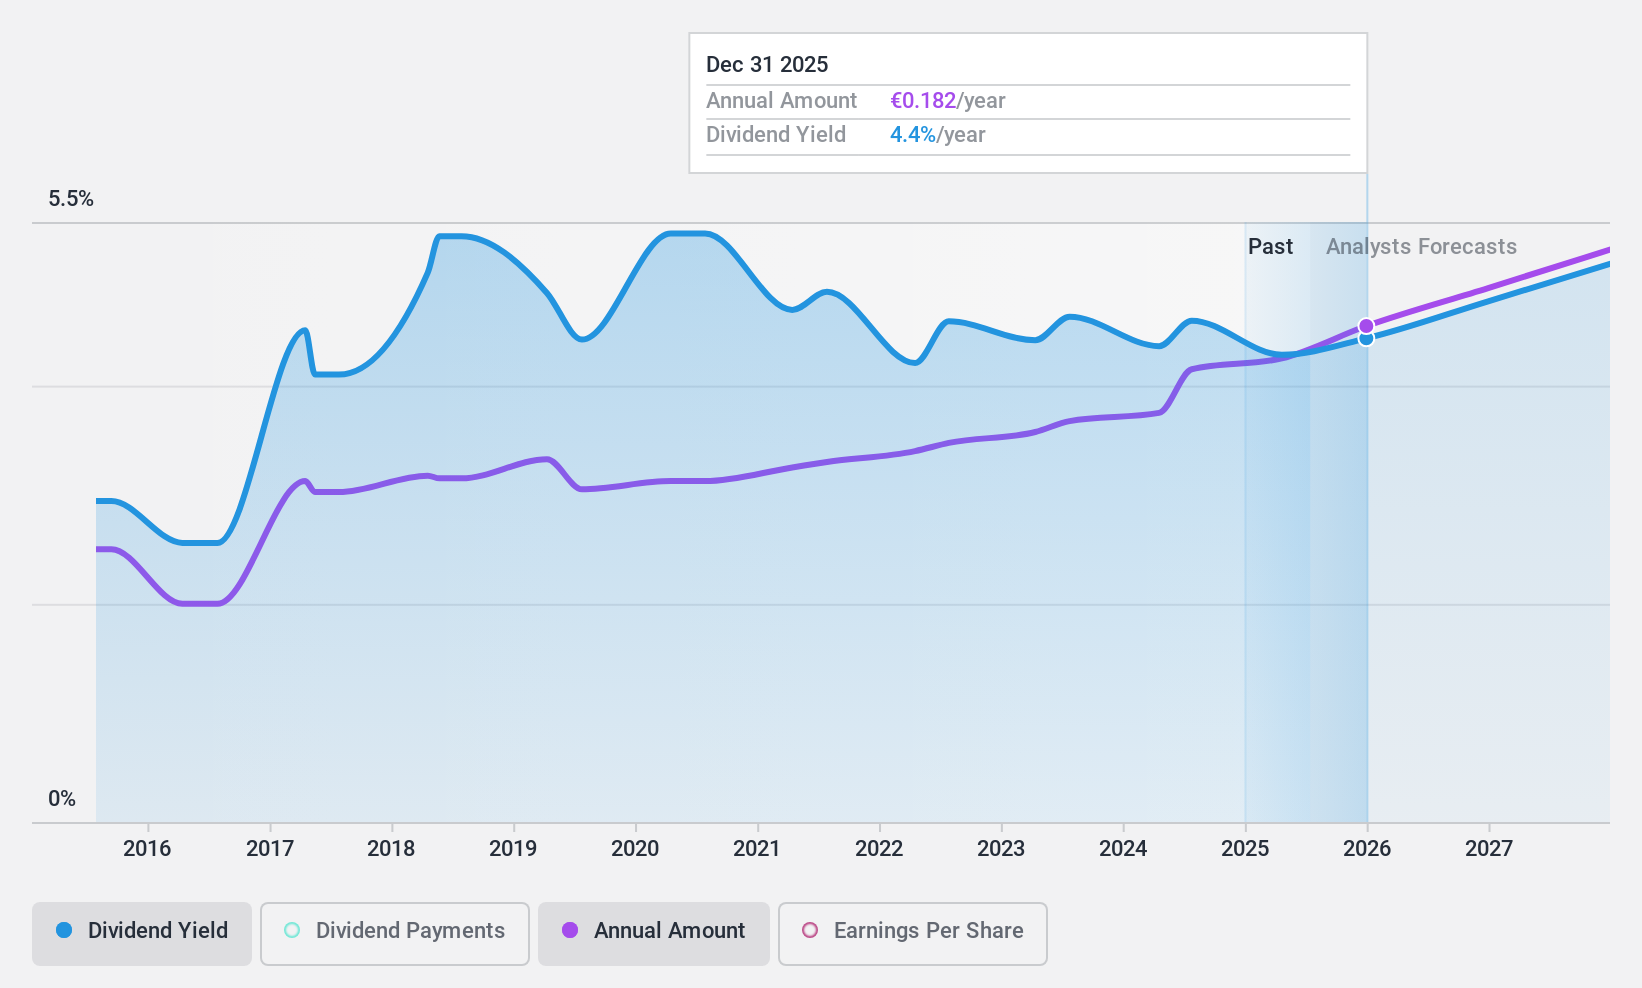
Dividend Yield: 4.4%
Koninklijke KPN's dividend sustainability is underpinned by a payout ratio of 78.4% and a cash payout ratio of 59.6%, indicating coverage by both earnings and cash flows. However, the company has experienced volatility in its dividend payments over the past decade, reflecting inconsistency in returns to shareholders. Despite this, KPN's recent financial performance shows resilience with Q1 sales up to €1.38 billion from €1.34 billion year-over-year; nevertheless, net income dipped to €174 million from €196 million, impacting earnings per share.
- Click here and access our complete dividend analysis report to understand the dynamics of Koninklijke KPN.
- Our valuation report unveils the possibility Koninklijke KPN's shares may be trading at a discount.
Randstad (ENXTAM:RAND)
Simply Wall St Dividend Rating: ★★★★☆☆
Overview: Randstad N.V. specializes in offering comprehensive solutions in the field of work and human resources services, with a market capitalization of approximately €8.90 billion.
Operations: Randstad N.V. generates its revenue primarily from comprehensive human resources services.
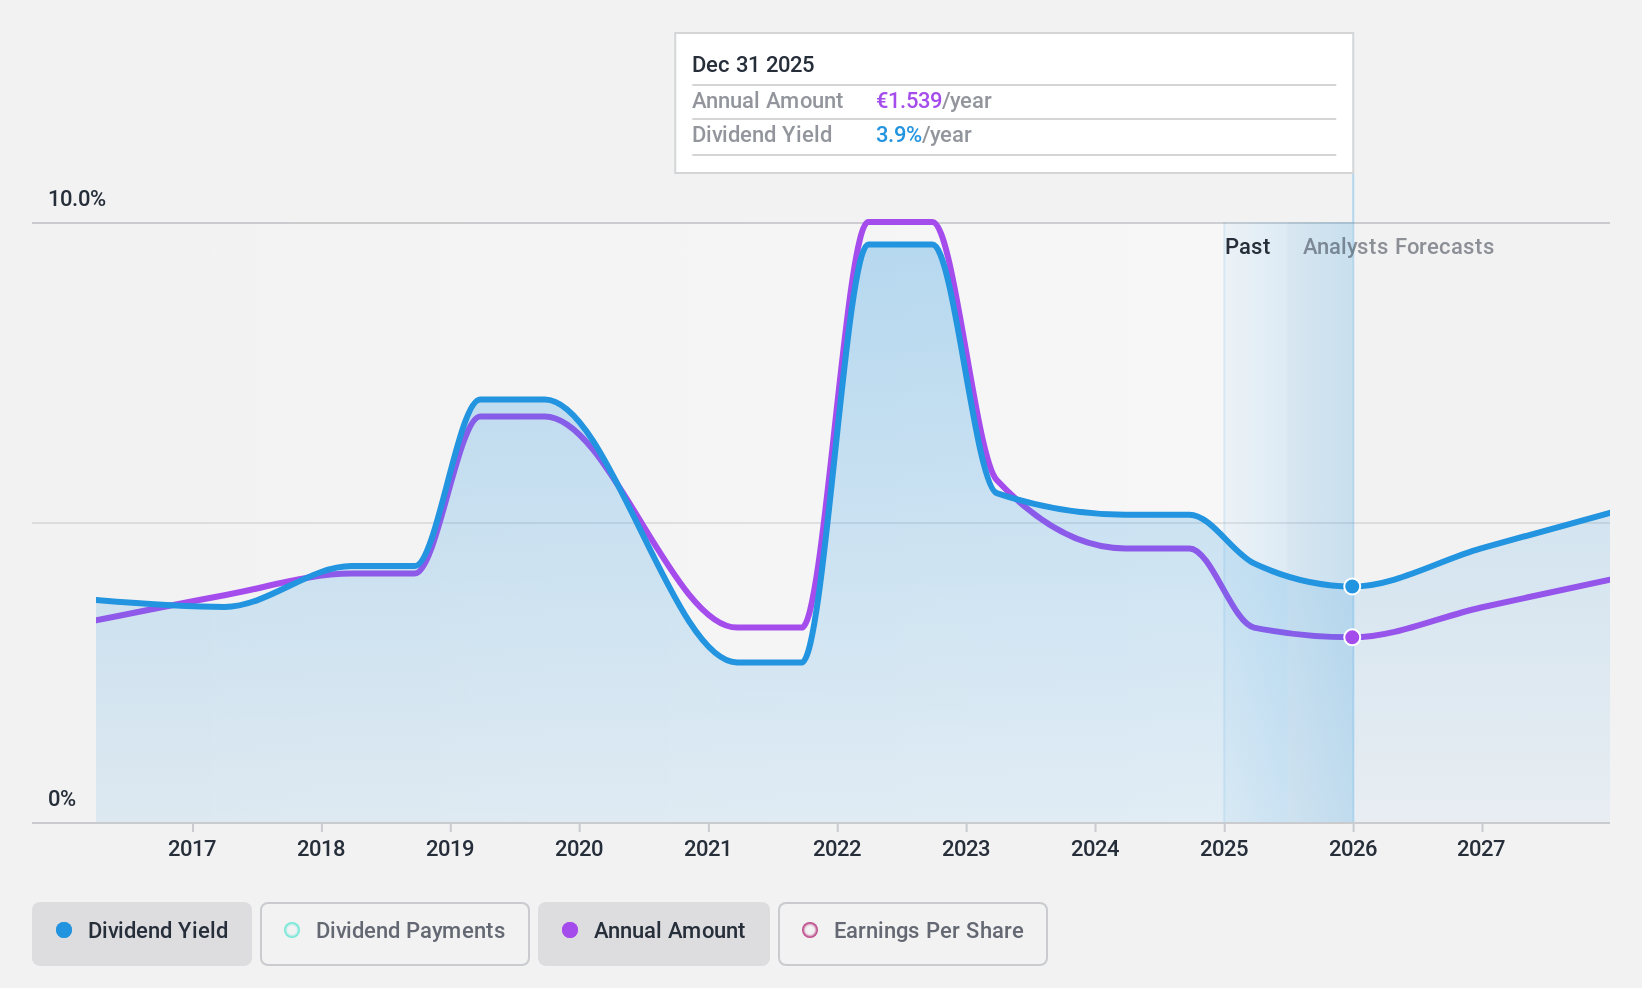
Dividend Yield: 4.5%
Randstad's current trading value is 46.6% below its estimated fair value, making it an attractive option in terms of price. However, its dividend yield at 4.54% is lower than the top quartile of Dutch dividend stocks at 5.5%. While dividends are well-covered by both earnings and cash flow, with payout ratios of 73.4% and 45.9% respectively, the company's history of dividend payments has been marked by instability and volatility over the past decade. Moreover, recent financials indicate a decline in sales to €5.94 billion from €6.52 billion year-over-year and a drop in net income to €88 million from €154 million, potentially influencing future dividend reliability.
- Navigate through the intricacies of Randstad with our comprehensive dividend report here.
- According our valuation report, there's an indication that Randstad's share price might be on the cheaper side.
Turning Ideas Into Actions
- Access the full spectrum of 5 Top Euronext Amsterdam Dividend Stocks by clicking on this link.
- Invested in any of these stocks? Simplify your portfolio management with Simply Wall St and stay ahead with our alerts for any critical updates on your stocks.
- Elevate your portfolio with Simply Wall St, the ultimate app for investors seeking global market coverage.
Ready For A Different Approach?
- Explore high-performing small cap companies that haven't yet garnered significant analyst attention.
- Fuel your portfolio with companies showing strong growth potential, backed by optimistic outlooks both from analysts and management.
- Find companies with promising cash flow potential yet trading below their fair value.
This article by Simply Wall St is general in nature. We provide commentary based on historical data and analyst forecasts only using an unbiased methodology and our articles are not intended to be financial advice. It does not constitute a recommendation to buy or sell any stock, and does not take account of your objectives, or your financial situation. We aim to bring you long-term focused analysis driven by fundamental data. Note that our analysis may not factor in the latest price-sensitive company announcements or qualitative material. Simply Wall St has no position in any stocks mentioned.
Valuation is complex, but we're helping make it simple.
Find out whether Randstad is potentially over or undervalued by checking out our comprehensive analysis, which includes fair value estimates, risks and warnings, dividends, insider transactions and financial health.
View the Free AnalysisHave feedback on this article? Concerned about the content? Get in touch with us directly. Alternatively, email editorial-team@simplywallst.com
About ENXTAM:RAND
Randstad
Provides solutions in the field of work and human resources (HR) services.
Flawless balance sheet, undervalued and pays a dividend.

