- Netherlands
- /
- Semiconductors
- /
- ENXTAM:ASML
Did You Participate In Any Of ASML Holding's (AMS:ASML) Incredible 481% Return?


Buying shares in the best businesses can build meaningful wealth for you and your family. While not every stock performs well, when investors win, they can win big. To wit, the ASML Holding N.V. (AMS:ASML) share price has soared 450% over five years. If that doesn't get you thinking about long term investing, we don't know what will. It's also good to see the share price up 50% over the last quarter. But this could be related to the strong market, which is up 25% in the last three months.
Check out our latest analysis for ASML Holding
While markets are a powerful pricing mechanism, share prices reflect investor sentiment, not just underlying business performance. One flawed but reasonable way to assess how sentiment around a company has changed is to compare the earnings per share (EPS) with the share price.
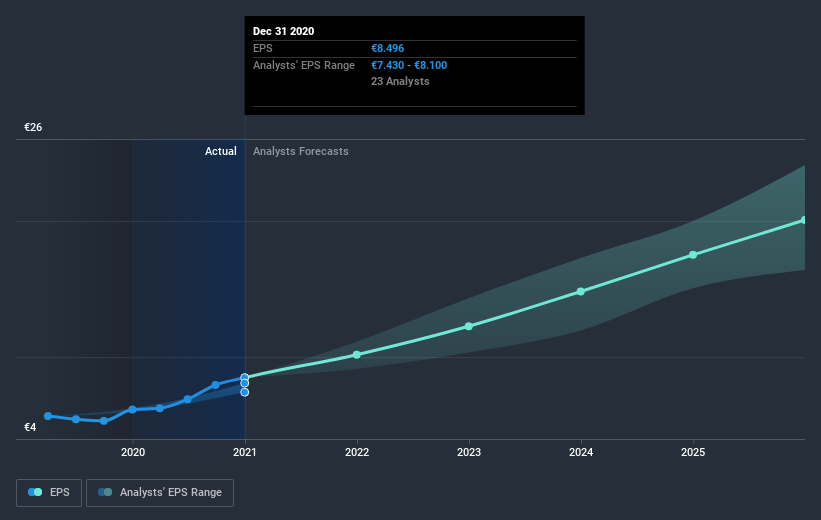
During five years of share price growth, ASML Holding achieved compound earnings per share (EPS) growth of 18% per year. This EPS growth is lower than the 41% average annual increase in the share price. So it's fair to assume the market has a higher opinion of the business than it did five years ago. And that's hardly shocking given the track record of growth. This optimism is visible in its fairly high P/E ratio of 54.49.
The graphic below depicts how EPS has changed over time (unveil the exact values by clicking on the image).
We know that ASML Holding has improved its bottom line lately, but is it going to grow revenue? This free report showing analyst revenue forecasts should help you figure out if the EPS growth can be sustained.
What About Dividends?
When looking at investment returns, it is important to consider the difference between total shareholder return (TSR) and share price return. The TSR incorporates the value of any spin-offs or discounted capital raisings, along with any dividends, based on the assumption that the dividends are reinvested. It's fair to say that the TSR gives a more complete picture for stocks that pay a dividend. In the case of ASML Holding, it has a TSR of 481% for the last 5 years. That exceeds its share price return that we previously mentioned. The dividends paid by the company have thusly boosted the total shareholder return.
A Different Perspective
It's good to see that ASML Holding has rewarded shareholders with a total shareholder return of 73% in the last twelve months. Of course, that includes the dividend. That's better than the annualised return of 42% over half a decade, implying that the company is doing better recently. Someone with an optimistic perspective could view the recent improvement in TSR as indicating that the business itself is getting better with time. It's always interesting to track share price performance over the longer term. But to understand ASML Holding better, we need to consider many other factors. Consider for instance, the ever-present spectre of investment risk. We've identified 1 warning sign with ASML Holding , and understanding them should be part of your investment process.
We will like ASML Holding better if we see some big insider buys. While we wait, check out this free list of growing companies with considerable, recent, insider buying.
Please note, the market returns quoted in this article reflect the market weighted average returns of stocks that currently trade on NL exchanges.
If you decide to trade ASML Holding, use the lowest-cost* platform that is rated #1 Overall by Barron’s, Interactive Brokers. Trade stocks, options, futures, forex, bonds and funds on 135 markets, all from a single integrated account. Promoted
New: Manage All Your Stock Portfolios in One Place
We've created the ultimate portfolio companion for stock investors, and it's free.
• Connect an unlimited number of Portfolios and see your total in one currency
• Be alerted to new Warning Signs or Risks via email or mobile
• Track the Fair Value of your stocks
This article by Simply Wall St is general in nature. It does not constitute a recommendation to buy or sell any stock, and does not take account of your objectives, or your financial situation. We aim to bring you long-term focused analysis driven by fundamental data. Note that our analysis may not factor in the latest price-sensitive company announcements or qualitative material. Simply Wall St has no position in any stocks mentioned.
*Interactive Brokers Rated Lowest Cost Broker by StockBrokers.com Annual Online Review 2020
Have feedback on this article? Concerned about the content? Get in touch with us directly. Alternatively, email editorial-team (at) simplywallst.com.
About ENXTAM:ASML
ASML Holding
Develops, produces, markets, sells, and services advanced semiconductor equipment systems for chipmakers.
High growth potential with excellent balance sheet.
