Stock Analysis
IFCA MSC Berhad's (KLSE:IFCAMSC) Financials Are Too Obscure To Link With Current Share Price Momentum: What's In Store For the Stock?


IFCA MSC Berhad's (KLSE:IFCAMSC) stock is up by a considerable 28% over the past three months. However, we decided to pay attention to the company's fundamentals which don't appear to give a clear sign about the company's financial health. Particularly, we will be paying attention to IFCA MSC Berhad's ROE today.
Return on equity or ROE is an important factor to be considered by a shareholder because it tells them how effectively their capital is being reinvested. In other words, it is a profitability ratio which measures the rate of return on the capital provided by the company's shareholders.
Check out our latest analysis for IFCA MSC Berhad
How Is ROE Calculated?
The formula for return on equity is:
Return on Equity = Net Profit (from continuing operations) ÷ Shareholders' Equity
So, based on the above formula, the ROE for IFCA MSC Berhad is:
2.2% = RM2.7m ÷ RM121m (Based on the trailing twelve months to December 2023).
The 'return' is the profit over the last twelve months. So, this means that for every MYR1 of its shareholder's investments, the company generates a profit of MYR0.02.
What Has ROE Got To Do With Earnings Growth?
We have already established that ROE serves as an efficient profit-generating gauge for a company's future earnings. Based on how much of its profits the company chooses to reinvest or "retain", we are then able to evaluate a company's future ability to generate profits. Generally speaking, other things being equal, firms with a high return on equity and profit retention, have a higher growth rate than firms that don’t share these attributes.
A Side By Side comparison of IFCA MSC Berhad's Earnings Growth And 2.2% ROE
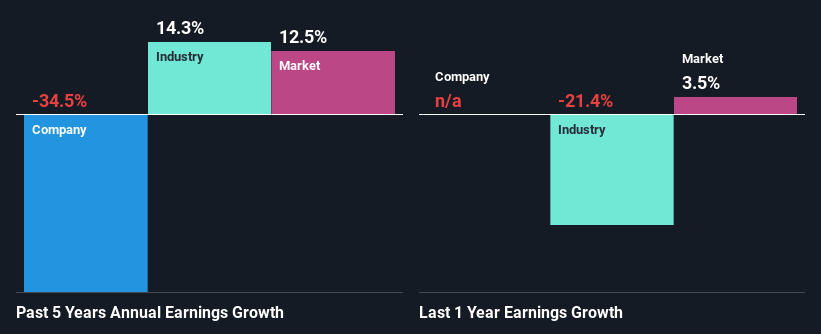
It is hard to argue that IFCA MSC Berhad's ROE is much good in and of itself. Not just that, even compared to the industry average of 7.6%, the company's ROE is entirely unremarkable. Given the circumstances, the significant decline in net income by 35% seen by IFCA MSC Berhad over the last five years is not surprising. We believe that there also might be other aspects that are negatively influencing the company's earnings prospects. Such as - low earnings retention or poor allocation of capital.
That being said, we compared IFCA MSC Berhad's performance with the industry and were concerned when we found that while the company has shrunk its earnings, the industry has grown its earnings at a rate of 14% in the same 5-year period.
Earnings growth is an important metric to consider when valuing a stock. What investors need to determine next is if the expected earnings growth, or the lack of it, is already built into the share price. This then helps them determine if the stock is placed for a bright or bleak future. If you're wondering about IFCA MSC Berhad's's valuation, check out this gauge of its price-to-earnings ratio, as compared to its industry.
Is IFCA MSC Berhad Efficiently Re-investing Its Profits?
While the company did payout a portion of its dividend in the past, it currently doesn't pay a regular dividend. This implies that potentially all of its profits are being reinvested in the business.
Conclusion
In total, we're a bit ambivalent about IFCA MSC Berhad's performance. While the company does have a high rate of reinvestment, the low ROE means that all that reinvestment is not reaping any benefit to its investors, and moreover, its having a negative impact on the earnings growth. Up till now, we've only made a short study of the company's growth data. So it may be worth checking this free detailed graph of IFCA MSC Berhad's past earnings, as well as revenue and cash flows to get a deeper insight into the company's performance.
Valuation is complex, but we're helping make it simple.
Find out whether IFCA MSC Berhad is potentially over or undervalued by checking out our comprehensive analysis, which includes fair value estimates, risks and warnings, dividends, insider transactions and financial health.
View the Free AnalysisHave feedback on this article? Concerned about the content? Get in touch with us directly. Alternatively, email editorial-team (at) simplywallst.com.
This article by Simply Wall St is general in nature. We provide commentary based on historical data and analyst forecasts only using an unbiased methodology and our articles are not intended to be financial advice. It does not constitute a recommendation to buy or sell any stock, and does not take account of your objectives, or your financial situation. We aim to bring you long-term focused analysis driven by fundamental data. Note that our analysis may not factor in the latest price-sensitive company announcements or qualitative material. Simply Wall St has no position in any stocks mentioned.
About KLSE:IFCAMSC
IFCA MSC Berhad
IFCA MSC Berhad, a business software solution company, engages in the research and development of enterprise-wide business solutions in Malaysia and internationally.
Flawless balance sheet with questionable track record.
