Stock Analysis
Market Cool On Harn Len Corporation Bhd's (KLSE:HARNLEN) Revenues Pushing Shares 30% Lower

Harn Len Corporation Bhd (KLSE:HARNLEN) shareholders won't be pleased to see that the share price has had a very rough month, dropping 30% and undoing the prior period's positive performance. Instead of being rewarded, shareholders who have already held through the last twelve months are now sitting on a 24% share price drop.
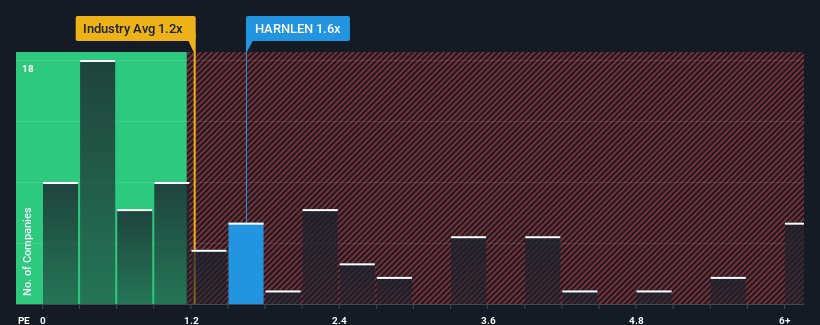
Although its price has dipped substantially, there still wouldn't be many who think Harn Len Corporation Bhd's price-to-sales (or "P/S") ratio of 1.6x is worth a mention when the median P/S in Malaysia's Food industry is similar at about 1.2x. While this might not raise any eyebrows, if the P/S ratio is not justified investors could be missing out on a potential opportunity or ignoring looming disappointment.
Check out our latest analysis for Harn Len Corporation Bhd
What Does Harn Len Corporation Bhd's Recent Performance Look Like?
As an illustration, revenue has deteriorated at Harn Len Corporation Bhd over the last year, which is not ideal at all. It might be that many expect the company to put the disappointing revenue performance behind them over the coming period, which has kept the P/S from falling. If you like the company, you'd at least be hoping this is the case so that you could potentially pick up some stock while it's not quite in favour.
Although there are no analyst estimates available for Harn Len Corporation Bhd, take a look at this free data-rich visualisation to see how the company stacks up on earnings, revenue and cash flow.What Are Revenue Growth Metrics Telling Us About The P/S?
Harn Len Corporation Bhd's P/S ratio would be typical for a company that's only expected to deliver moderate growth, and importantly, perform in line with the industry.
Retrospectively, the last year delivered a frustrating 16% decrease to the company's top line. Even so, admirably revenue has lifted 65% in aggregate from three years ago, notwithstanding the last 12 months. Although it's been a bumpy ride, it's still fair to say the revenue growth recently has been more than adequate for the company.
This is in contrast to the rest of the industry, which is expected to grow by 5.1% over the next year, materially lower than the company's recent medium-term annualised growth rates.
In light of this, it's curious that Harn Len Corporation Bhd's P/S sits in line with the majority of other companies. Apparently some shareholders believe the recent performance is at its limits and have been accepting lower selling prices.
The Key Takeaway
With its share price dropping off a cliff, the P/S for Harn Len Corporation Bhd looks to be in line with the rest of the Food industry. We'd say the price-to-sales ratio's power isn't primarily as a valuation instrument but rather to gauge current investor sentiment and future expectations.
We didn't quite envision Harn Len Corporation Bhd's P/S sitting in line with the wider industry, considering the revenue growth over the last three-year is higher than the current industry outlook. When we see strong revenue with faster-than-industry growth, we can only assume potential risks are what might be placing pressure on the P/S ratio. At least the risk of a price drop looks to be subdued if recent medium-term revenue trends continue, but investors seem to think future revenue could see some volatility.
Before you take the next step, you should know about the 3 warning signs for Harn Len Corporation Bhd that we have uncovered.
If strong companies turning a profit tickle your fancy, then you'll want to check out this free list of interesting companies that trade on a low P/E (but have proven they can grow earnings).
Valuation is complex, but we're helping make it simple.
Find out whether Harn Len Corporation Bhd is potentially over or undervalued by checking out our comprehensive analysis, which includes fair value estimates, risks and warnings, dividends, insider transactions and financial health.
View the Free AnalysisHave feedback on this article? Concerned about the content? Get in touch with us directly. Alternatively, email editorial-team (at) simplywallst.com.
This article by Simply Wall St is general in nature. We provide commentary based on historical data and analyst forecasts only using an unbiased methodology and our articles are not intended to be financial advice. It does not constitute a recommendation to buy or sell any stock, and does not take account of your objectives, or your financial situation. We aim to bring you long-term focused analysis driven by fundamental data. Note that our analysis may not factor in the latest price-sensitive company announcements or qualitative material. Simply Wall St has no position in any stocks mentioned.
About KLSE:HARNLEN
Harn Len Corporation Bhd
Harn Len Corporation Bhd, together with its subsidiaries, engages in the cultivation of oil palm in Malaysia.
Adequate balance sheet with acceptable track record.
