Stock Analysis
- Malaysia
- /
- Food and Staples Retail
- /
- KLSE:KTC
Are Robust Financials Driving The Recent Rally In Kim Teck Cheong Consolidated Berhad's (KLSE:KTC) Stock?

Most readers would already be aware that Kim Teck Cheong Consolidated Berhad's (KLSE:KTC) stock increased significantly by 12% over the past week. Since the market usually pay for a company’s long-term fundamentals, we decided to study the company’s key performance indicators to see if they could be influencing the market. Particularly, we will be paying attention to Kim Teck Cheong Consolidated Berhad's ROE today.
Return on equity or ROE is a key measure used to assess how efficiently a company's management is utilizing the company's capital. In other words, it is a profitability ratio which measures the rate of return on the capital provided by the company's shareholders.
See our latest analysis for Kim Teck Cheong Consolidated Berhad
How To Calculate Return On Equity?
Return on equity can be calculated by using the formula:
Return on Equity = Net Profit (from continuing operations) ÷ Shareholders' Equity
So, based on the above formula, the ROE for Kim Teck Cheong Consolidated Berhad is:
12% = RM24m ÷ RM198m (Based on the trailing twelve months to December 2023).
The 'return' is the yearly profit. So, this means that for every MYR1 of its shareholder's investments, the company generates a profit of MYR0.12.
What Has ROE Got To Do With Earnings Growth?
Thus far, we have learned that ROE measures how efficiently a company is generating its profits. Based on how much of its profits the company chooses to reinvest or "retain", we are then able to evaluate a company's future ability to generate profits. Generally speaking, other things being equal, firms with a high return on equity and profit retention, have a higher growth rate than firms that don’t share these attributes.
Kim Teck Cheong Consolidated Berhad's Earnings Growth And 12% ROE
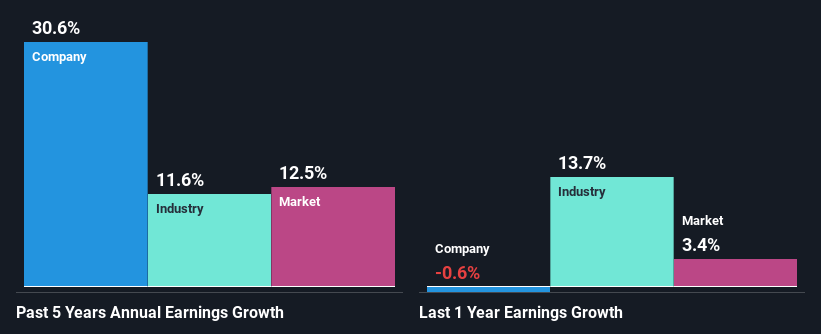
To begin with, Kim Teck Cheong Consolidated Berhad seems to have a respectable ROE. On comparing with the average industry ROE of 9.1% the company's ROE looks pretty remarkable. This certainly adds some context to Kim Teck Cheong Consolidated Berhad's exceptional 31% net income growth seen over the past five years. We reckon that there could also be other factors at play here. For example, it is possible that the company's management has made some good strategic decisions, or that the company has a low payout ratio.
We then compared Kim Teck Cheong Consolidated Berhad's net income growth with the industry and we're pleased to see that the company's growth figure is higher when compared with the industry which has a growth rate of 12% in the same 5-year period.
Earnings growth is a huge factor in stock valuation. It’s important for an investor to know whether the market has priced in the company's expected earnings growth (or decline). By doing so, they will have an idea if the stock is headed into clear blue waters or if swampy waters await. Is Kim Teck Cheong Consolidated Berhad fairly valued compared to other companies? These 3 valuation measures might help you decide.
Is Kim Teck Cheong Consolidated Berhad Using Its Retained Earnings Effectively?
Kim Teck Cheong Consolidated Berhad doesn't pay any dividend to its shareholders, meaning that the company has been reinvesting all of its profits into the business. This is likely what's driving the high earnings growth number discussed above.
Summary
On the whole, we feel that Kim Teck Cheong Consolidated Berhad's performance has been quite good. Particularly, we like that the company is reinvesting heavily into its business, and at a high rate of return. Unsurprisingly, this has led to an impressive earnings growth. If the company continues to grow its earnings the way it has, that could have a positive impact on its share price given how earnings per share influence long-term share prices. Not to forget, share price outcomes are also dependent on the potential risks a company may face. So it is important for investors to be aware of the risks involved in the business. You can see the 3 risks we have identified for Kim Teck Cheong Consolidated Berhad by visiting our risks dashboard for free on our platform here.
Valuation is complex, but we're helping make it simple.
Find out whether Kim Teck Cheong Consolidated Berhad is potentially over or undervalued by checking out our comprehensive analysis, which includes fair value estimates, risks and warnings, dividends, insider transactions and financial health.
View the Free AnalysisHave feedback on this article? Concerned about the content? Get in touch with us directly. Alternatively, email editorial-team (at) simplywallst.com.
This article by Simply Wall St is general in nature. We provide commentary based on historical data and analyst forecasts only using an unbiased methodology and our articles are not intended to be financial advice. It does not constitute a recommendation to buy or sell any stock, and does not take account of your objectives, or your financial situation. We aim to bring you long-term focused analysis driven by fundamental data. Note that our analysis may not factor in the latest price-sensitive company announcements or qualitative material. Simply Wall St has no position in any stocks mentioned.
About KLSE:KTC
Kim Teck Cheong Consolidated Berhad
Kim Teck Cheong Consolidated Berhad engages in distribution of consumer packaged goods in East Malaysia and Brunei.
Adequate balance sheet and slightly overvalued.
