Stock Analysis
- Mexico
- /
- Industrials
- /
- BMV:GCARSO A1
Grupo Carso. de (BMV:GCARSOA1) stock performs better than its underlying earnings growth over last three years


The most you can lose on any stock (assuming you don't use leverage) is 100% of your money. But if you buy shares in a really great company, you can more than double your money. For instance the Grupo Carso, S.A.B. de C.V. (BMV:GCARSOA1) share price is 158% higher than it was three years ago. How nice for those who held the stock! It's also up 8.4% in about a month. This could be related to the recent financial results that were recently released - you could check the most recent data by reading our company report.
After a strong gain in the past week, it's worth seeing if longer term returns have been driven by improving fundamentals.
Check out our latest analysis for Grupo Carso. de
In his essay The Superinvestors of Graham-and-Doddsville Warren Buffett described how share prices do not always rationally reflect the value of a business. One flawed but reasonable way to assess how sentiment around a company has changed is to compare the earnings per share (EPS) with the share price.
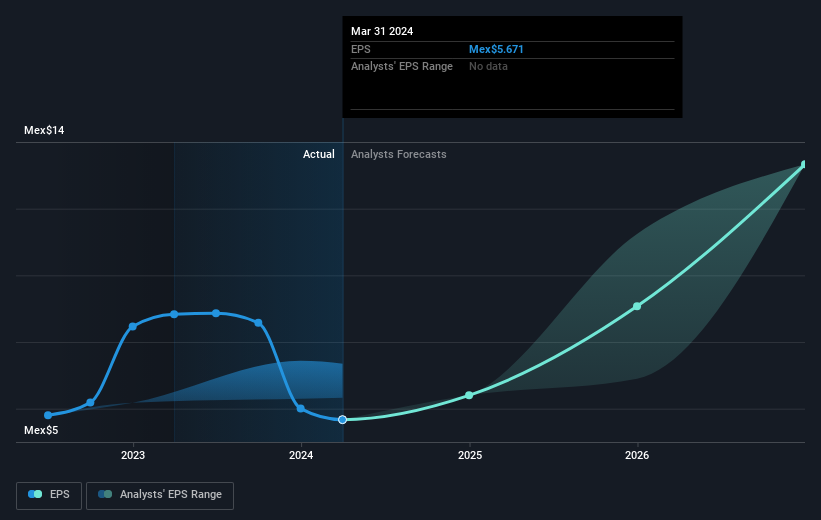
Grupo Carso. de was able to grow its EPS at 32% per year over three years, sending the share price higher. We don't think it is entirely coincidental that the EPS growth is reasonably close to the 37% average annual increase in the share price. This observation indicates that the market's attitude to the business hasn't changed all that much. Au contraire, the share price change has arguably mimicked the EPS growth.
You can see how EPS has changed over time in the image below (click on the chart to see the exact values).
It is of course excellent to see how Grupo Carso. de has grown profits over the years, but the future is more important for shareholders. It might be well worthwhile taking a look at our free report on how its financial position has changed over time.
What About Dividends?
When looking at investment returns, it is important to consider the difference between total shareholder return (TSR) and share price return. The TSR incorporates the value of any spin-offs or discounted capital raisings, along with any dividends, based on the assumption that the dividends are reinvested. It's fair to say that the TSR gives a more complete picture for stocks that pay a dividend. As it happens, Grupo Carso. de's TSR for the last 3 years was 168%, which exceeds the share price return mentioned earlier. And there's no prize for guessing that the dividend payments largely explain the divergence!
A Different Perspective
We're pleased to report that Grupo Carso. de shareholders have received a total shareholder return of 45% over one year. And that does include the dividend. That's better than the annualised return of 17% over half a decade, implying that the company is doing better recently. Given the share price momentum remains strong, it might be worth taking a closer look at the stock, lest you miss an opportunity. While it is well worth considering the different impacts that market conditions can have on the share price, there are other factors that are even more important. Take risks, for example - Grupo Carso. de has 2 warning signs we think you should be aware of.
Of course Grupo Carso. de may not be the best stock to buy. So you may wish to see this free collection of growth stocks.
Please note, the market returns quoted in this article reflect the market weighted average returns of stocks that currently trade on Mexican exchanges.
Valuation is complex, but we're helping make it simple.
Find out whether Grupo Carso. de is potentially over or undervalued by checking out our comprehensive analysis, which includes fair value estimates, risks and warnings, dividends, insider transactions and financial health.
View the Free AnalysisHave feedback on this article? Concerned about the content? Get in touch with us directly. Alternatively, email editorial-team (at) simplywallst.com.
This article by Simply Wall St is general in nature. We provide commentary based on historical data and analyst forecasts only using an unbiased methodology and our articles are not intended to be financial advice. It does not constitute a recommendation to buy or sell any stock, and does not take account of your objectives, or your financial situation. We aim to bring you long-term focused analysis driven by fundamental data. Note that our analysis may not factor in the latest price-sensitive company announcements or qualitative material. Simply Wall St has no position in any stocks mentioned.
About BMV:GCARSO A1
Grupo Carso. de
Engages in the commercial, industrial, infrastructure and construction, and energy sectors.
Excellent balance sheet with reasonable growth potential.

