Stock Analysis
Investors in HSBC Bank Malta (MTSE:HSB) have seen favorable returns of 47% over the past year


If you want to compound wealth in the stock market, you can do so by buying an index fund. But investors can boost returns by picking market-beating companies to own shares in. For example, the HSBC Bank Malta p.l.c. (MTSE:HSB) share price is up 39% in the last 1 year, clearly besting the market decline of around 2.8% (not including dividends). If it can keep that out-performance up over the long term, investors will do very well! The longer term returns have not been as good, with the stock price only 10.0% higher than it was three years ago.
Let's take a look at the underlying fundamentals over the longer term, and see if they've been consistent with shareholders returns.
See our latest analysis for HSBC Bank Malta
In his essay The Superinvestors of Graham-and-Doddsville Warren Buffett described how share prices do not always rationally reflect the value of a business. One imperfect but simple way to consider how the market perception of a company has shifted is to compare the change in the earnings per share (EPS) with the share price movement.
HSBC Bank Malta was able to grow EPS by 112% in the last twelve months. This EPS growth is significantly higher than the 39% increase in the share price. Therefore, it seems the market isn't as excited about HSBC Bank Malta as it was before. This could be an opportunity. The caution is also evident in the lowish P/E ratio of 10.55.
The image below shows how EPS has tracked over time (if you click on the image you can see greater detail).
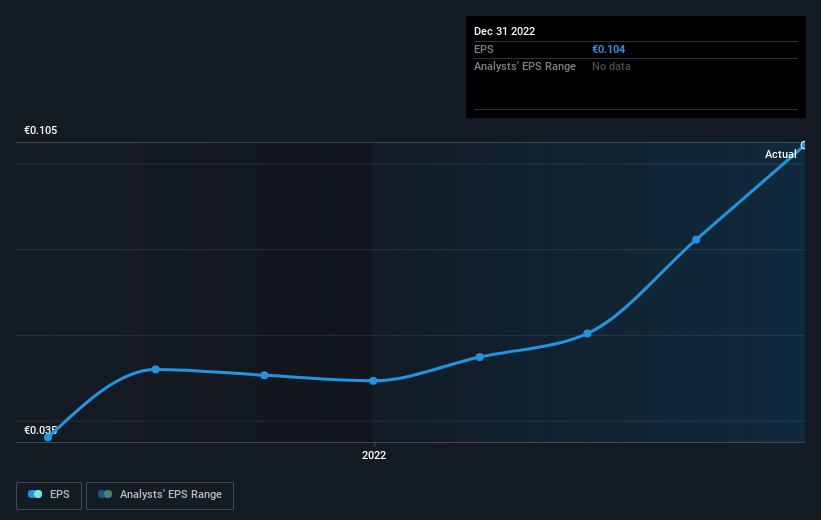
It might be well worthwhile taking a look at our free report on HSBC Bank Malta's earnings, revenue and cash flow.
What About Dividends?
When looking at investment returns, it is important to consider the difference between total shareholder return (TSR) and share price return. Whereas the share price return only reflects the change in the share price, the TSR includes the value of dividends (assuming they were reinvested) and the benefit of any discounted capital raising or spin-off. Arguably, the TSR gives a more comprehensive picture of the return generated by a stock. In the case of HSBC Bank Malta, it has a TSR of 47% for the last 1 year. That exceeds its share price return that we previously mentioned. This is largely a result of its dividend payments!
A Different Perspective
We're pleased to report that HSBC Bank Malta shareholders have received a total shareholder return of 47% over one year. That's including the dividend. There's no doubt those recent returns are much better than the TSR loss of 5% per year over five years. The long term loss makes us cautious, but the short term TSR gain certainly hints at a brighter future. It's always interesting to track share price performance over the longer term. But to understand HSBC Bank Malta better, we need to consider many other factors. Consider for instance, the ever-present spectre of investment risk. We've identified 3 warning signs with HSBC Bank Malta (at least 1 which makes us a bit uncomfortable) , and understanding them should be part of your investment process.
But note: HSBC Bank Malta may not be the best stock to buy. So take a peek at this free list of interesting companies with past earnings growth (and further growth forecast).
Please note, the market returns quoted in this article reflect the market weighted average returns of stocks that currently trade on Maltese exchanges.
Valuation is complex, but we're helping make it simple.
Find out whether HSBC Bank Malta is potentially over or undervalued by checking out our comprehensive analysis, which includes fair value estimates, risks and warnings, dividends, insider transactions and financial health.
View the Free AnalysisHave feedback on this article? Concerned about the content? Get in touch with us directly. Alternatively, email editorial-team (at) simplywallst.com.
This article by Simply Wall St is general in nature. We provide commentary based on historical data and analyst forecasts only using an unbiased methodology and our articles are not intended to be financial advice. It does not constitute a recommendation to buy or sell any stock, and does not take account of your objectives, or your financial situation. We aim to bring you long-term focused analysis driven by fundamental data. Note that our analysis may not factor in the latest price-sensitive company announcements or qualitative material. Simply Wall St has no position in any stocks mentioned.
About MTSE:HSB
HSBC Bank Malta
HSBC Bank Malta p.l.c., together with its subsidiaries, provides various banking and related financial services in Malta.
Solid track record with adequate balance sheet and pays a dividend.
