Stock Analysis
- Luxembourg
- /
- Media
- /
- BDL:SESGL
SES (BDL:SESGL) shareholders have endured a 43% loss from investing in the stock five years ago


The main aim of stock picking is to find the market-beating stocks. But even the best stock picker will only win with some selections. At this point some shareholders may be questioning their investment in SES S.A. (BDL:SESGL), since the last five years saw the share price fall 56%.
Since shareholders are down over the longer term, lets look at the underlying fundamentals over the that time and see if they've been consistent with returns.
View our latest analysis for SES
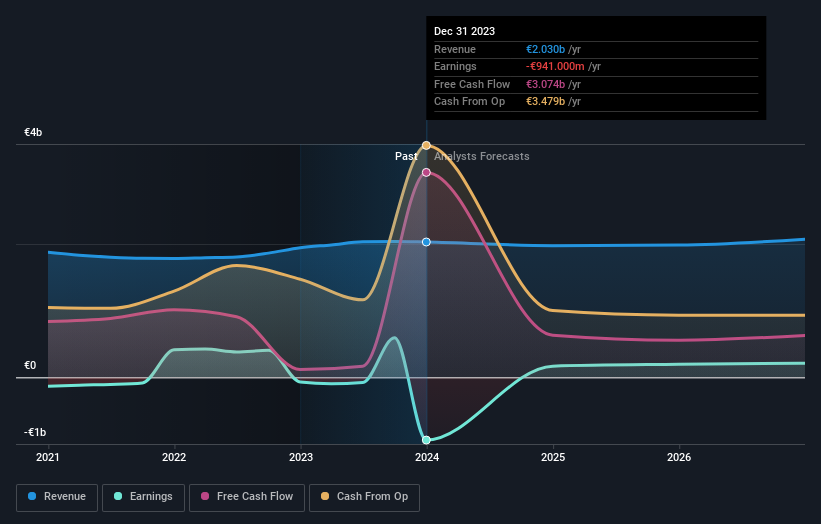
SES wasn't profitable in the last twelve months, it is unlikely we'll see a strong correlation between its share price and its earnings per share (EPS). Arguably revenue is our next best option. Shareholders of unprofitable companies usually expect strong revenue growth. That's because it's hard to be confident a company will be sustainable if revenue growth is negligible, and it never makes a profit.
Over half a decade SES reduced its trailing twelve month revenue by 0.4% for each year. While far from catastrophic that is not good. The share price decline of 9% compound, over five years, is understandable given the company is losing money, and revenue is moving in the wrong direction. The chance of imminent investor enthusiasm for this stock seems slimmer than Louise Brooks. Not that many investors like to invest in companies that are losing money and not growing revenue.
The graphic below depicts how earnings and revenue have changed over time (unveil the exact values by clicking on the image).
Take a more thorough look at SES' financial health with this free report on its balance sheet.
What About Dividends?
When looking at investment returns, it is important to consider the difference between total shareholder return (TSR) and share price return. The TSR incorporates the value of any spin-offs or discounted capital raisings, along with any dividends, based on the assumption that the dividends are reinvested. Arguably, the TSR gives a more comprehensive picture of the return generated by a stock. In the case of SES, it has a TSR of -43% for the last 5 years. That exceeds its share price return that we previously mentioned. This is largely a result of its dividend payments!
A Different Perspective
SES shareholders are up 11% for the year (even including dividends). Unfortunately this falls short of the market return. But at least that's still a gain! Over five years the TSR has been a reduction of 7% per year, over five years. So this might be a sign the business has turned its fortunes around. It's always interesting to track share price performance over the longer term. But to understand SES better, we need to consider many other factors. For example, we've discovered 1 warning sign for SES that you should be aware of before investing here.
Of course SES may not be the best stock to buy. So you may wish to see this free collection of growth stocks.
Please note, the market returns quoted in this article reflect the market weighted average returns of stocks that currently trade on Luxembourger exchanges.
Valuation is complex, but we're helping make it simple.
Find out whether SES is potentially over or undervalued by checking out our comprehensive analysis, which includes fair value estimates, risks and warnings, dividends, insider transactions and financial health.
View the Free AnalysisHave feedback on this article? Concerned about the content? Get in touch with us directly. Alternatively, email editorial-team (at) simplywallst.com.
This article by Simply Wall St is general in nature. We provide commentary based on historical data and analyst forecasts only using an unbiased methodology and our articles are not intended to be financial advice. It does not constitute a recommendation to buy or sell any stock, and does not take account of your objectives, or your financial situation. We aim to bring you long-term focused analysis driven by fundamental data. Note that our analysis may not factor in the latest price-sensitive company announcements or qualitative material. Simply Wall St has no position in any stocks mentioned.
About BDL:SESGL
SES
SES S.A. provides satellite-based data transmission capacity and ancillary services worldwide.
Adequate balance sheet and fair value.
