- South Korea
- /
- Semiconductors
- /
- KOSDAQ:A240810
KRX Stocks That May Be Undervalued In August 2024

Reviewed by Simply Wall St

In the last week, the South Korean market has stayed flat, with the Utilities sector gaining 11%. Despite this stability and a flat performance over the past 12 months, earnings are forecast to grow by 29% annually. Identifying undervalued stocks in such a market can provide significant opportunities for investors looking to capitalize on potential growth.
Top 10 Undervalued Stocks Based On Cash Flows In South Korea
| Name | Current Price | Fair Value (Est) | Discount (Est) |
| Neosem (KOSDAQ:A253590) | ₩9780.00 | ₩17867.61 | 45.3% |
| JUSUNG ENGINEERINGLtd (KOSDAQ:A036930) | ₩27750.00 | ₩50143.98 | 44.7% |
| Wonik Ips (KOSDAQ:A240810) | ₩33250.00 | ₩64890.13 | 48.8% |
| Global Tax Free (KOSDAQ:A204620) | ₩3690.00 | ₩6833.33 | 46% |
| Raonsecure (KOSDAQ:A042510) | ₩2245.00 | ₩4382.91 | 48.8% |
| Jeisys Medical (KOSDAQ:A287410) | ₩12850.00 | ₩23802.65 | 46% |
| Lutronic (KOSDAQ:A085370) | ₩36700.00 | ₩63217.94 | 41.9% |
| Hanall Biopharma (KOSE:A009420) | ₩37750.00 | ₩70271.91 | 46.3% |
| ABCO Electronics (KOSDAQ:A036010) | ₩5900.00 | ₩11468.91 | 48.6% |
| Shinsung E&GLtd (KOSE:A011930) | ₩1734.00 | ₩3000.74 | 42.2% |
Below we spotlight a couple of our favorites from our exclusive screener.
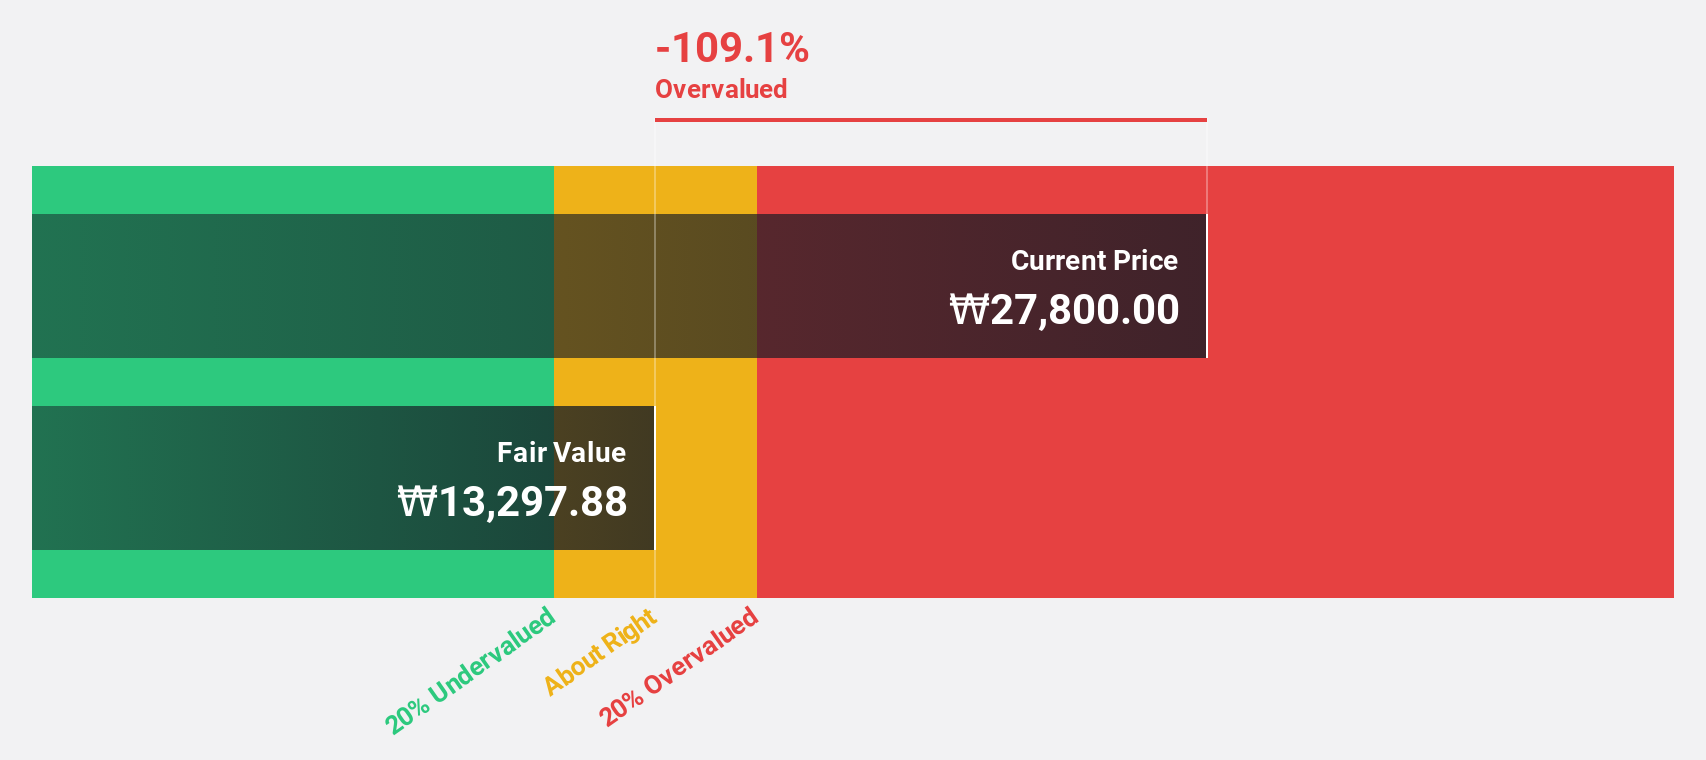
Wonik Ips (KOSDAQ:A240810)
Overview: Wonik IPS Co., Ltd researches, develops, manufactures, and sells semiconductor, display, and solar cell systems in South Korea with a market cap of ₩1.62 trillion.
Operations: The company generates revenue primarily through its Semiconductor Equipment Division, which reported ₩666.74 billion.
Estimated Discount To Fair Value: 48.8%
Wonik Ips is trading at ₩33,250, significantly below its estimated fair value of ₩64,890.13. Analysts agree the stock price could rise by 29.8%. Its revenue is forecast to grow at 22.6% annually, outpacing the South Korean market's 10.6% growth rate. Earnings are expected to increase by 88.91% per year, with profitability anticipated within three years despite a modest future return on equity of 11.2%.
- Our growth report here indicates Wonik Ips may be poised for an improving outlook.
- Get an in-depth perspective on Wonik Ips' balance sheet by reading our health report here.
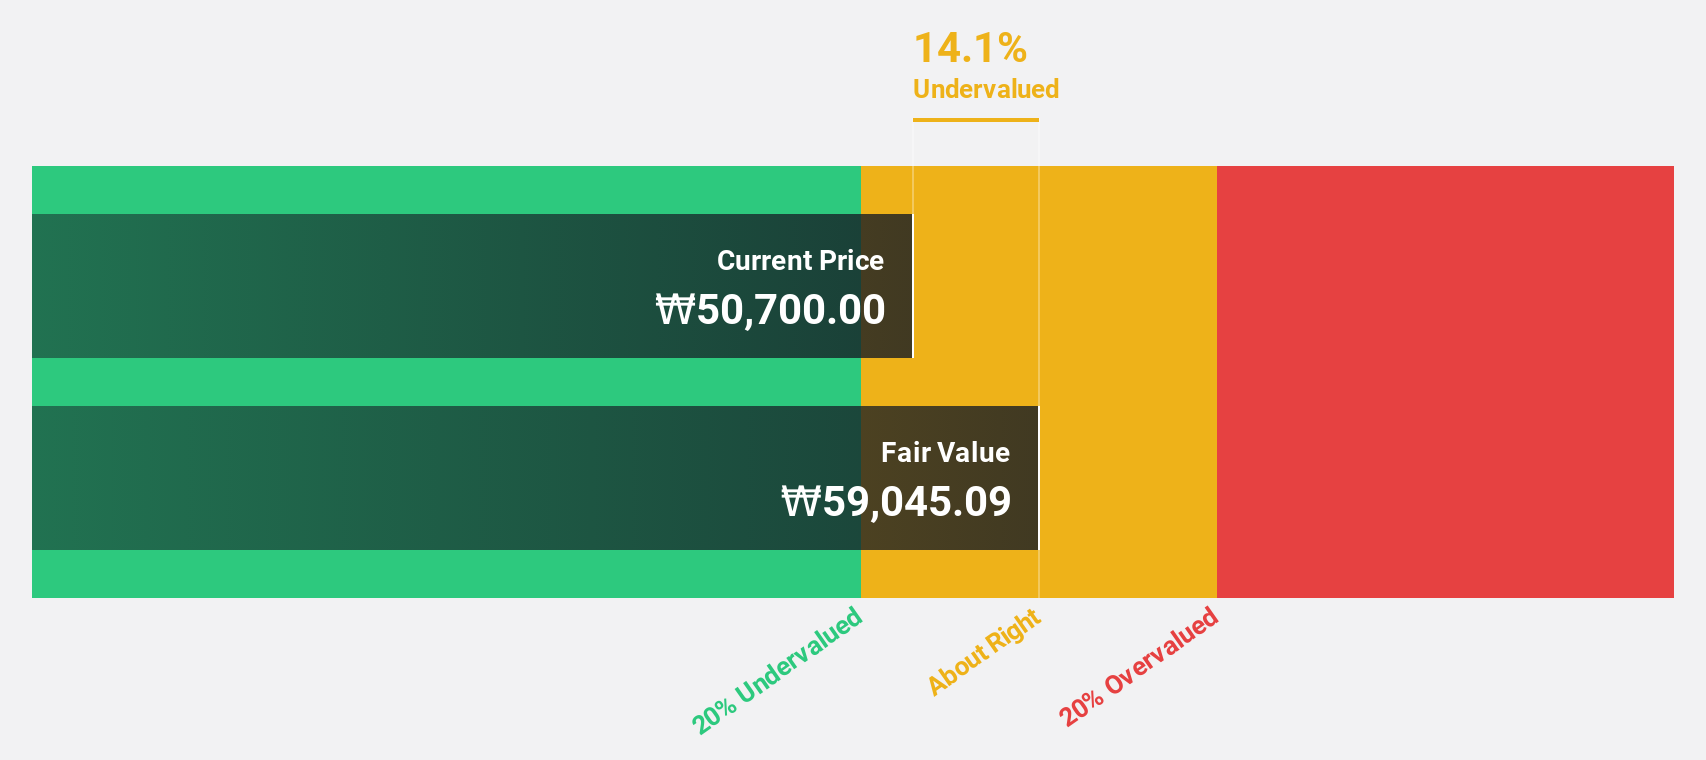
Hotel ShillaLtd (KOSE:A008770)
Overview: Hotel Shilla Co., Ltd operates as a hospitality company in South Korea and internationally, with a market cap of ₩1.82 trillion.
Operations: Hotel Shilla Co., Ltd generates revenue primarily from Travel Retail (₩3.31 trillion) and the Hotel & Leisure Sector (₩701.77 billion).
Estimated Discount To Fair Value: 41.2%
Hotel Shilla Ltd. is trading at ₩48,450, well below its estimated fair value of ₩82,390.93. The company is forecast to become profitable over the next three years with an annual earnings growth rate of 70.42%. Revenue is expected to grow at 11.7% per year, slightly faster than the South Korean market's 10.6% rate but slower than high-growth benchmarks. However, interest payments are not well covered by earnings, highlighting a potential risk factor despite its undervaluation based on cash flows.
- Our expertly prepared growth report on Hotel ShillaLtd implies its future financial outlook may be stronger than recent results.
- Click to explore a detailed breakdown of our findings in Hotel ShillaLtd's balance sheet health report.
Hd Hyundai MipoLtd (KOSE:A010620)
Overview: Hd Hyundai Mipo Co., Ltd. is a South Korean company that manufactures, repairs, and remodels ships with a market cap of ₩4 trillion.
Operations: Revenue Segments (in millions of ₩): Shipbuilding: 5096863, Connection Adjustment: -870773 The company's revenue primarily comes from its shipbuilding segment, generating ₩5.10 trillion.
Estimated Discount To Fair Value: 30%
Hd Hyundai Mipo Ltd. is trading at ₩101,800, significantly below its estimated fair value of ₩145,527.91. The company is expected to become profitable within the next three years and has an annual earnings growth forecast of 93.98%. Although revenue growth is projected at 11.5% per year—faster than the South Korean market's 10.6%—the return on equity is anticipated to be relatively low at 16.1%.
- Upon reviewing our latest growth report, Hd Hyundai MipoLtd's projected financial performance appears quite optimistic.
- Click here to discover the nuances of Hd Hyundai MipoLtd with our detailed financial health report.

Summing It All Up
- Reveal the 32 hidden gems among our Undervalued KRX Stocks Based On Cash Flows screener with a single click here.
- Have a stake in these businesses? Integrate your holdings into Simply Wall St's portfolio for notifications and detailed stock reports.
- Join a community of smart investors by using Simply Wall St. It's free and delivers expert-level analysis on worldwide markets.
Interested In Other Possibilities?
- Explore high-performing small cap companies that haven't yet garnered significant analyst attention.
- Diversify your portfolio with solid dividend payers offering reliable income streams to weather potential market turbulence.
- Fuel your portfolio with companies showing strong growth potential, backed by optimistic outlooks both from analysts and management.
This article by Simply Wall St is general in nature. We provide commentary based on historical data and analyst forecasts only using an unbiased methodology and our articles are not intended to be financial advice. It does not constitute a recommendation to buy or sell any stock, and does not take account of your objectives, or your financial situation. We aim to bring you long-term focused analysis driven by fundamental data. Note that our analysis may not factor in the latest price-sensitive company announcements or qualitative material. Simply Wall St has no position in any stocks mentioned.
Valuation is complex, but we're here to simplify it.
Discover if Wonik Ips might be undervalued or overvalued with our detailed analysis, featuring fair value estimates, potential risks, dividends, insider trades, and its financial condition.
Access Free AnalysisHave feedback on this article? Concerned about the content? Get in touch with us directly. Alternatively, email editorial-team@simplywallst.com
About KOSDAQ:A240810
Wonik Ips
Wonik IPS Co., Ltd primarily researches and develops, manufactures, and sells semiconductor, display, and solar cell systems in South Korea.
Flawless balance sheet and undervalued.
