Stock Analysis
- South Korea
- /
- Semiconductors
- /
- KOSDAQ:A083450
Global Standard Technology's (KOSDAQ:083450) 48% CAGR outpaced the company's earnings growth over the same five-year period

Long term investing can be life changing when you buy and hold the truly great businesses. And highest quality companies can see their share prices grow by huge amounts. To wit, the Global Standard Technology, Limited (KOSDAQ:083450) share price has soared 550% over five years. This just goes to show the value creation that some businesses can achieve. On top of that, the share price is up 77% in about a quarter. Anyone who held for that rewarding ride would probably be keen to talk about it.
Since it's been a strong week for Global Standard Technology shareholders, let's have a look at trend of the longer term fundamentals.
View our latest analysis for Global Standard Technology
To quote Buffett, 'Ships will sail around the world but the Flat Earth Society will flourish. There will continue to be wide discrepancies between price and value in the marketplace...' One way to examine how market sentiment has changed over time is to look at the interaction between a company's share price and its earnings per share (EPS).
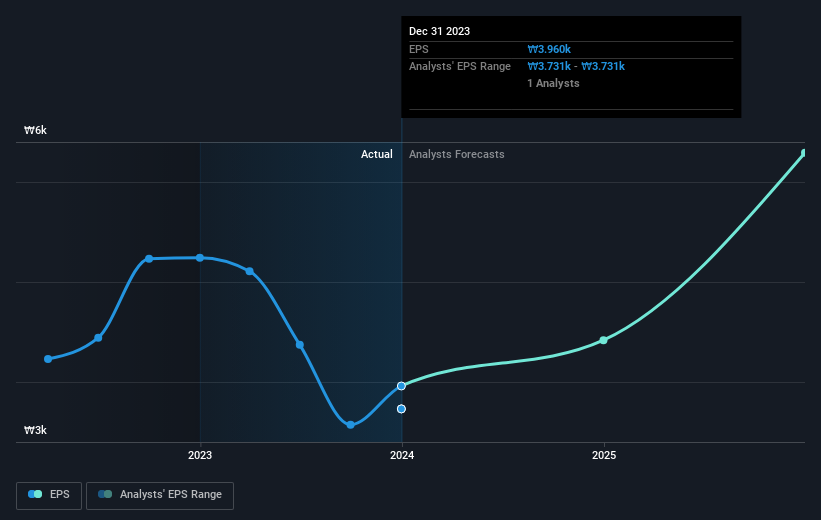
During five years of share price growth, Global Standard Technology achieved compound earnings per share (EPS) growth of 30% per year. This EPS growth is slower than the share price growth of 45% per year, over the same period. So it's fair to assume the market has a higher opinion of the business than it did five years ago. That's not necessarily surprising considering the five-year track record of earnings growth.
You can see how EPS has changed over time in the image below (click on the chart to see the exact values).
We know that Global Standard Technology has improved its bottom line over the last three years, but what does the future have in store? You can see how its balance sheet has strengthened (or weakened) over time in this free interactive graphic.
What About Dividends?
As well as measuring the share price return, investors should also consider the total shareholder return (TSR). Whereas the share price return only reflects the change in the share price, the TSR includes the value of dividends (assuming they were reinvested) and the benefit of any discounted capital raising or spin-off. It's fair to say that the TSR gives a more complete picture for stocks that pay a dividend. As it happens, Global Standard Technology's TSR for the last 5 years was 598%, which exceeds the share price return mentioned earlier. The dividends paid by the company have thusly boosted the total shareholder return.
A Different Perspective
It's nice to see that Global Standard Technology shareholders have received a total shareholder return of 99% over the last year. Of course, that includes the dividend. That gain is better than the annual TSR over five years, which is 48%. Therefore it seems like sentiment around the company has been positive lately. Given the share price momentum remains strong, it might be worth taking a closer look at the stock, lest you miss an opportunity. It's always interesting to track share price performance over the longer term. But to understand Global Standard Technology better, we need to consider many other factors. Consider for instance, the ever-present spectre of investment risk. We've identified 1 warning sign with Global Standard Technology , and understanding them should be part of your investment process.
We will like Global Standard Technology better if we see some big insider buys. While we wait, check out this free list of growing companies with considerable, recent, insider buying.
Please note, the market returns quoted in this article reflect the market weighted average returns of stocks that currently trade on South Korean exchanges.
Valuation is complex, but we're helping make it simple.
Find out whether Global Standard Technology is potentially over or undervalued by checking out our comprehensive analysis, which includes fair value estimates, risks and warnings, dividends, insider transactions and financial health.
View the Free AnalysisHave feedback on this article? Concerned about the content? Get in touch with us directly. Alternatively, email editorial-team (at) simplywallst.com.
This article by Simply Wall St is general in nature. We provide commentary based on historical data and analyst forecasts only using an unbiased methodology and our articles are not intended to be financial advice. It does not constitute a recommendation to buy or sell any stock, and does not take account of your objectives, or your financial situation. We aim to bring you long-term focused analysis driven by fundamental data. Note that our analysis may not factor in the latest price-sensitive company announcements or qualitative material. Simply Wall St has no position in any stocks mentioned.
About KOSDAQ:A083450
Global Standard Technology
Global Standard Technology, Limited, together with its subsidiaries, engages in the environmental and energy industry in South Korea and internationally.
Flawless balance sheet and good value.
