Stock Analysis
- South Korea
- /
- Packaging
- /
- KOSDAQ:A014970
SAMRYOONG Co.,Ltd's (KOSDAQ:014970) On An Uptrend But Financial Prospects Look Pretty Weak: Is The Stock Overpriced?

SAMRYOONGLtd's (KOSDAQ:014970) stock is up by a considerable 12% over the past week. However, we decided to pay close attention to its weak financials as we are doubtful that the current momentum will keep up, given the scenario. Specifically, we decided to study SAMRYOONGLtd's ROE in this article.
ROE or return on equity is a useful tool to assess how effectively a company can generate returns on the investment it received from its shareholders. Simply put, it is used to assess the profitability of a company in relation to its equity capital.
See our latest analysis for SAMRYOONGLtd
How Do You Calculate Return On Equity?
The formula for return on equity is:
Return on Equity = Net Profit (from continuing operations) ÷ Shareholders' Equity
So, based on the above formula, the ROE for SAMRYOONGLtd is:
3.4% = ₩2.0b ÷ ₩60b (Based on the trailing twelve months to December 2023).
The 'return' is the yearly profit. So, this means that for every ₩1 of its shareholder's investments, the company generates a profit of ₩0.03.
What Is The Relationship Between ROE And Earnings Growth?
Thus far, we have learned that ROE measures how efficiently a company is generating its profits. Based on how much of its profits the company chooses to reinvest or "retain", we are then able to evaluate a company's future ability to generate profits. Assuming everything else remains unchanged, the higher the ROE and profit retention, the higher the growth rate of a company compared to companies that don't necessarily bear these characteristics.
A Side By Side comparison of SAMRYOONGLtd's Earnings Growth And 3.4% ROE
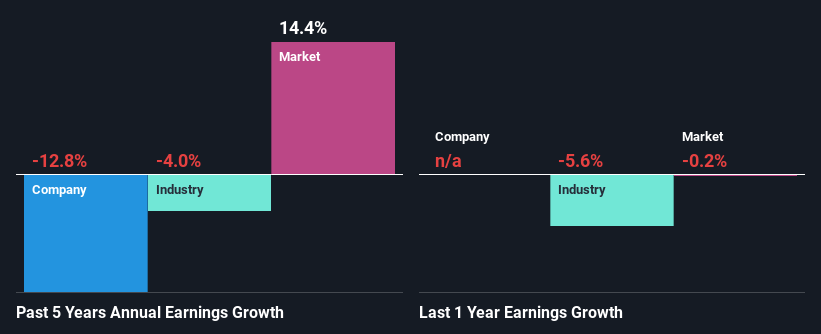
It is hard to argue that SAMRYOONGLtd's ROE is much good in and of itself. Even compared to the average industry ROE of 6.5%, the company's ROE is quite dismal. Therefore, it might not be wrong to say that the five year net income decline of 13% seen by SAMRYOONGLtd was possibly a result of it having a lower ROE. However, there could also be other factors causing the earnings to decline. Such as - low earnings retention or poor allocation of capital.
Next, when we compared with the industry, which has shrunk its earnings at a rate of 4.0% in the same 5-year period, we still found SAMRYOONGLtd's performance to be quite bleak, because the company has been shrinking its earnings faster than the industry.
Earnings growth is a huge factor in stock valuation. It’s important for an investor to know whether the market has priced in the company's expected earnings growth (or decline). By doing so, they will have an idea if the stock is headed into clear blue waters or if swampy waters await. Is SAMRYOONGLtd fairly valued compared to other companies? These 3 valuation measures might help you decide.
Is SAMRYOONGLtd Using Its Retained Earnings Effectively?
SAMRYOONGLtd's declining earnings is not surprising given how the company is spending most of its profits in paying dividends, judging by its LTM (or last twelve month) payout ratio of 56% (or a retention ratio of 44%). The business is only left with a small pool of capital to reinvest - A vicious cycle that doesn't benefit the company in the long-run. To know the 2 risks we have identified for SAMRYOONGLtd visit our risks dashboard for free.
Additionally, SAMRYOONGLtd has paid dividends over a period of five years, which means that the company's management is rather focused on keeping up its dividend payments, regardless of the shrinking earnings.
Conclusion
In total, we would have a hard think before deciding on any investment action concerning SAMRYOONGLtd. The company has seen a lack of earnings growth as a result of retaining very little profits and whatever little it does retain, is being reinvested at a very low rate of return. Up till now, we've only made a short study of the company's growth data. You can do your own research on SAMRYOONGLtd and see how it has performed in the past by looking at this FREE detailed graph of past earnings, revenue and cash flows.
Valuation is complex, but we're helping make it simple.
Find out whether SAMRYOONGLtd is potentially over or undervalued by checking out our comprehensive analysis, which includes fair value estimates, risks and warnings, dividends, insider transactions and financial health.
View the Free AnalysisHave feedback on this article? Concerned about the content? Get in touch with us directly. Alternatively, email editorial-team (at) simplywallst.com.
This article by Simply Wall St is general in nature. We provide commentary based on historical data and analyst forecasts only using an unbiased methodology and our articles are not intended to be financial advice. It does not constitute a recommendation to buy or sell any stock, and does not take account of your objectives, or your financial situation. We aim to bring you long-term focused analysis driven by fundamental data. Note that our analysis may not factor in the latest price-sensitive company announcements or qualitative material. Simply Wall St has no position in any stocks mentioned.
About KOSDAQ:A014970
SAMRYOONGLtd
SAMRYOONG Co.,Ltd provides liquid packaging products in South Korea.
Excellent balance sheet with acceptable track record.
