Stock Analysis
- South Korea
- /
- Commercial Services
- /
- KOSDAQ:A063570
NICE Total Cash Management's (KOSDAQ:063570) earnings trajectory could turn positive as the stock swells 11% this past week


This week we saw the NICE Total Cash Management Co., Ltd (KOSDAQ:063570) share price climb by 11%. But over the last half decade, the stock has not performed well. In fact, the share price is down 40%, which falls well short of the return you could get by buying an index fund.
On a more encouraging note the company has added ₩18b to its market cap in just the last 7 days, so let's see if we can determine what's driven the five-year loss for shareholders.
View our latest analysis for NICE Total Cash Management
To quote Buffett, 'Ships will sail around the world but the Flat Earth Society will flourish. There will continue to be wide discrepancies between price and value in the marketplace...' One way to examine how market sentiment has changed over time is to look at the interaction between a company's share price and its earnings per share (EPS).
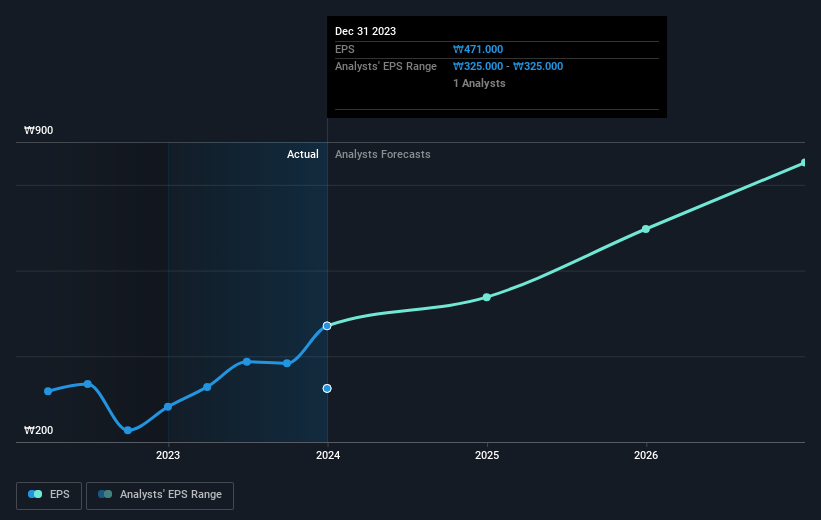
Looking back five years, both NICE Total Cash Management's share price and EPS declined; the latter at a rate of 7.7% per year. This reduction in EPS is less than the 10% annual reduction in the share price. So it seems the market was too confident about the business, in the past.
You can see below how EPS has changed over time (discover the exact values by clicking on the image).
It is of course excellent to see how NICE Total Cash Management has grown profits over the years, but the future is more important for shareholders. If you are thinking of buying or selling NICE Total Cash Management stock, you should check out this FREE detailed report on its balance sheet.
What About Dividends?
It is important to consider the total shareholder return, as well as the share price return, for any given stock. The TSR is a return calculation that accounts for the value of cash dividends (assuming that any dividend received was reinvested) and the calculated value of any discounted capital raisings and spin-offs. Arguably, the TSR gives a more comprehensive picture of the return generated by a stock. As it happens, NICE Total Cash Management's TSR for the last 5 years was -34%, which exceeds the share price return mentioned earlier. And there's no prize for guessing that the dividend payments largely explain the divergence!
A Different Perspective
It's good to see that NICE Total Cash Management has rewarded shareholders with a total shareholder return of 20% in the last twelve months. Of course, that includes the dividend. Notably the five-year annualised TSR loss of 6% per year compares very unfavourably with the recent share price performance. We generally put more weight on the long term performance over the short term, but the recent improvement could hint at a (positive) inflection point within the business. I find it very interesting to look at share price over the long term as a proxy for business performance. But to truly gain insight, we need to consider other information, too. Take risks, for example - NICE Total Cash Management has 2 warning signs (and 1 which doesn't sit too well with us) we think you should know about.
If you are like me, then you will not want to miss this free list of growing companies that insiders are buying.
Please note, the market returns quoted in this article reflect the market weighted average returns of stocks that currently trade on South Korean exchanges.
Valuation is complex, but we're helping make it simple.
Find out whether NICE Total Cash Management is potentially over or undervalued by checking out our comprehensive analysis, which includes fair value estimates, risks and warnings, dividends, insider transactions and financial health.
View the Free AnalysisHave feedback on this article? Concerned about the content? Get in touch with us directly. Alternatively, email editorial-team (at) simplywallst.com.
This article by Simply Wall St is general in nature. We provide commentary based on historical data and analyst forecasts only using an unbiased methodology and our articles are not intended to be financial advice. It does not constitute a recommendation to buy or sell any stock, and does not take account of your objectives, or your financial situation. We aim to bring you long-term focused analysis driven by fundamental data. Note that our analysis may not factor in the latest price-sensitive company announcements or qualitative material. Simply Wall St has no position in any stocks mentioned.
About KOSDAQ:A063570
NICE Total Cash Management
NICE Total Cash Management Co., Ltd. engages in the operation and management of unmanned systems in South Korea.
Solid track record and fair value.
