Stock Analysis
- South Korea
- /
- Electrical
- /
- KOSDAQ:A119850
GnCenergy (KOSDAQ:119850) shareholders YoY returns are lagging the company's 184% one-year earnings growth

GnCenergy Co., Ltd (KOSDAQ:119850) shareholders might be concerned after seeing the share price drop 14% in the last week. Despite this, the stock is a strong performer over the last year, no doubt about that. Indeed, the share price is up an impressive 102% in that time. So it is important to view the recent reduction in price through that lense. More important, going forward, is how the business itself is going.
While the stock has fallen 14% this week, it's worth focusing on the longer term and seeing if the stocks historical returns have been driven by the underlying fundamentals.
View our latest analysis for GnCenergy
While the efficient markets hypothesis continues to be taught by some, it has been proven that markets are over-reactive dynamic systems, and investors are not always rational. One imperfect but simple way to consider how the market perception of a company has shifted is to compare the change in the earnings per share (EPS) with the share price movement.
During the last year GnCenergy grew its earnings per share (EPS) by 184%. This EPS growth is significantly higher than the 102% increase in the share price. Therefore, it seems the market isn't as excited about GnCenergy as it was before. This could be an opportunity. The caution is also evident in the lowish P/E ratio of 9.79.
The graphic below depicts how EPS has changed over time (unveil the exact values by clicking on the image).
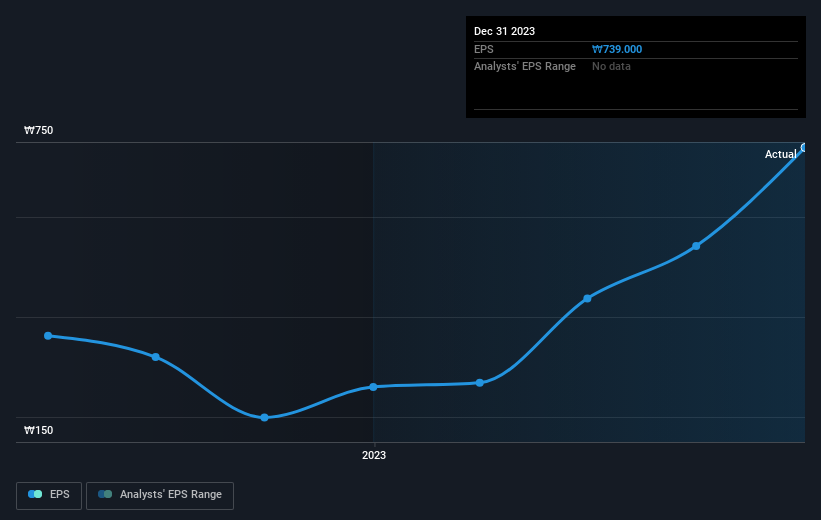
Dive deeper into GnCenergy's key metrics by checking this interactive graph of GnCenergy's earnings, revenue and cash flow.
What About Dividends?
When looking at investment returns, it is important to consider the difference between total shareholder return (TSR) and share price return. The TSR is a return calculation that accounts for the value of cash dividends (assuming that any dividend received was reinvested) and the calculated value of any discounted capital raisings and spin-offs. So for companies that pay a generous dividend, the TSR is often a lot higher than the share price return. As it happens, GnCenergy's TSR for the last 1 year was 105%, which exceeds the share price return mentioned earlier. This is largely a result of its dividend payments!
A Different Perspective
It's good to see that GnCenergy has rewarded shareholders with a total shareholder return of 105% in the last twelve months. Of course, that includes the dividend. That's better than the annualised return of 11% over half a decade, implying that the company is doing better recently. Someone with an optimistic perspective could view the recent improvement in TSR as indicating that the business itself is getting better with time. While it is well worth considering the different impacts that market conditions can have on the share price, there are other factors that are even more important. Consider for instance, the ever-present spectre of investment risk. We've identified 3 warning signs with GnCenergy (at least 1 which is concerning) , and understanding them should be part of your investment process.
But note: GnCenergy may not be the best stock to buy. So take a peek at this free list of interesting companies with past earnings growth (and further growth forecast).
Please note, the market returns quoted in this article reflect the market weighted average returns of stocks that currently trade on South Korean exchanges.
Valuation is complex, but we're helping make it simple.
Find out whether GnCenergy is potentially over or undervalued by checking out our comprehensive analysis, which includes fair value estimates, risks and warnings, dividends, insider transactions and financial health.
View the Free AnalysisHave feedback on this article? Concerned about the content? Get in touch with us directly. Alternatively, email editorial-team (at) simplywallst.com.
This article by Simply Wall St is general in nature. We provide commentary based on historical data and analyst forecasts only using an unbiased methodology and our articles are not intended to be financial advice. It does not constitute a recommendation to buy or sell any stock, and does not take account of your objectives, or your financial situation. We aim to bring you long-term focused analysis driven by fundamental data. Note that our analysis may not factor in the latest price-sensitive company announcements or qualitative material. Simply Wall St has no position in any stocks mentioned.
About KOSDAQ:A119850
GnCenergy
GnCenergy Co., Ltd engages in the manufacture and sale of power generators in Korea.
Flawless balance sheet with proven track record.
