Stock Analysis
- Japan
- /
- Electronic Equipment and Components
- /
- TSE:6645
OMRON's (TSE:6645) earnings have declined over three years, contributing to shareholders 35% loss


In order to justify the effort of selecting individual stocks, it's worth striving to beat the returns from a market index fund. But in any portfolio, there are likely to be some stocks that fall short of that benchmark. Unfortunately, that's been the case for longer term OMRON Corporation (TSE:6645) shareholders, since the share price is down 38% in the last three years, falling well short of the market return of around 43%. And over the last year the share price fell 31%, so we doubt many shareholders are delighted. Furthermore, it's down 22% in about a quarter. That's not much fun for holders.
While the stock has risen 4.9% in the past week but long term shareholders are still in the red, let's see what the fundamentals can tell us.
View our latest analysis for OMRON
There is no denying that markets are sometimes efficient, but prices do not always reflect underlying business performance. One imperfect but simple way to consider how the market perception of a company has shifted is to compare the change in the earnings per share (EPS) with the share price movement.
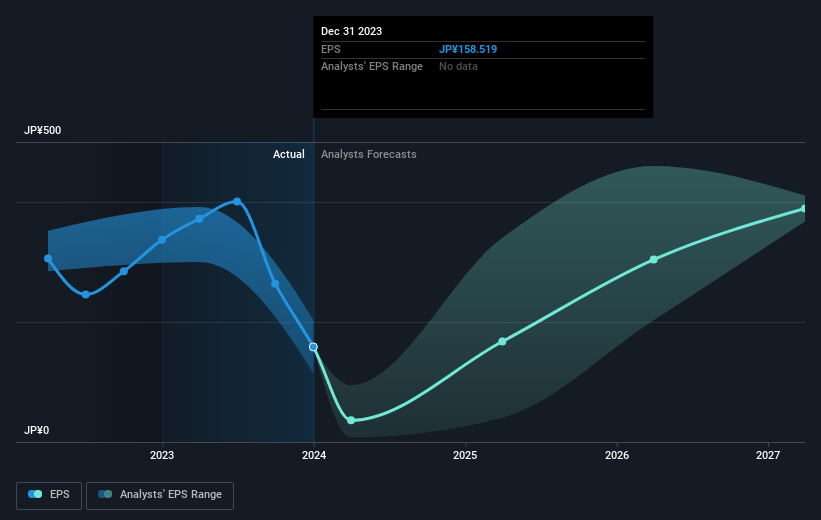
OMRON saw its EPS decline at a compound rate of 7.5% per year, over the last three years. The share price decline of 15% is actually steeper than the EPS slippage. So it seems the market was too confident about the business, in the past.
You can see how EPS has changed over time in the image below (click on the chart to see the exact values).
This free interactive report on OMRON's earnings, revenue and cash flow is a great place to start, if you want to investigate the stock further.
What About Dividends?
As well as measuring the share price return, investors should also consider the total shareholder return (TSR). The TSR is a return calculation that accounts for the value of cash dividends (assuming that any dividend received was reinvested) and the calculated value of any discounted capital raisings and spin-offs. It's fair to say that the TSR gives a more complete picture for stocks that pay a dividend. As it happens, OMRON's TSR for the last 3 years was -35%, which exceeds the share price return mentioned earlier. The dividends paid by the company have thusly boosted the total shareholder return.
A Different Perspective
OMRON shareholders are down 29% for the year (even including dividends), but the market itself is up 31%. Even the share prices of good stocks drop sometimes, but we want to see improvements in the fundamental metrics of a business, before getting too interested. Regrettably, last year's performance caps off a bad run, with the shareholders facing a total loss of 1.0% per year over five years. Generally speaking long term share price weakness can be a bad sign, though contrarian investors might want to research the stock in hope of a turnaround. I find it very interesting to look at share price over the long term as a proxy for business performance. But to truly gain insight, we need to consider other information, too. To that end, you should learn about the 3 warning signs we've spotted with OMRON (including 1 which is potentially serious) .
Of course OMRON may not be the best stock to buy. So you may wish to see this free collection of growth stocks.
Please note, the market returns quoted in this article reflect the market weighted average returns of stocks that currently trade on Japanese exchanges.
Valuation is complex, but we're helping make it simple.
Find out whether OMRON is potentially over or undervalued by checking out our comprehensive analysis, which includes fair value estimates, risks and warnings, dividends, insider transactions and financial health.
View the Free AnalysisHave feedback on this article? Concerned about the content? Get in touch with us directly. Alternatively, email editorial-team (at) simplywallst.com.
This article by Simply Wall St is general in nature. We provide commentary based on historical data and analyst forecasts only using an unbiased methodology and our articles are not intended to be financial advice. It does not constitute a recommendation to buy or sell any stock, and does not take account of your objectives, or your financial situation. We aim to bring you long-term focused analysis driven by fundamental data. Note that our analysis may not factor in the latest price-sensitive company announcements or qualitative material. Simply Wall St has no position in any stocks mentioned.
About TSE:6645
OMRON
OMRON Corporation engages in industrial automation, device and module solutions, social systems, and healthcare businesses worldwide.
Reasonable growth potential with adequate balance sheet.
