Stock Analysis
Are Robust Financials Driving The Recent Rally In SB Technology Corp.'s (TSE:4726) Stock?


Most readers would already be aware that SB Technology's (TSE:4726) stock increased significantly by 29% over the past week. Given the company's impressive performance, we decided to study its financial indicators more closely as a company's financial health over the long-term usually dictates market outcomes. Particularly, we will be paying attention to SB Technology's ROE today.
Return on equity or ROE is a key measure used to assess how efficiently a company's management is utilizing the company's capital. In other words, it is a profitability ratio which measures the rate of return on the capital provided by the company's shareholders.
Check out our latest analysis for SB Technology
How Is ROE Calculated?
Return on equity can be calculated by using the formula:
Return on Equity = Net Profit (from continuing operations) ÷ Shareholders' Equity
So, based on the above formula, the ROE for SB Technology is:
28% = JP¥8.9b ÷ JP¥31b (Based on the trailing twelve months to December 2023).
The 'return' refers to a company's earnings over the last year. Another way to think of that is that for every ¥1 worth of equity, the company was able to earn ¥0.28 in profit.
Why Is ROE Important For Earnings Growth?
So far, we've learned that ROE is a measure of a company's profitability. We now need to evaluate how much profit the company reinvests or "retains" for future growth which then gives us an idea about the growth potential of the company. Assuming everything else remains unchanged, the higher the ROE and profit retention, the higher the growth rate of a company compared to companies that don't necessarily bear these characteristics.
A Side By Side comparison of SB Technology's Earnings Growth And 28% ROE
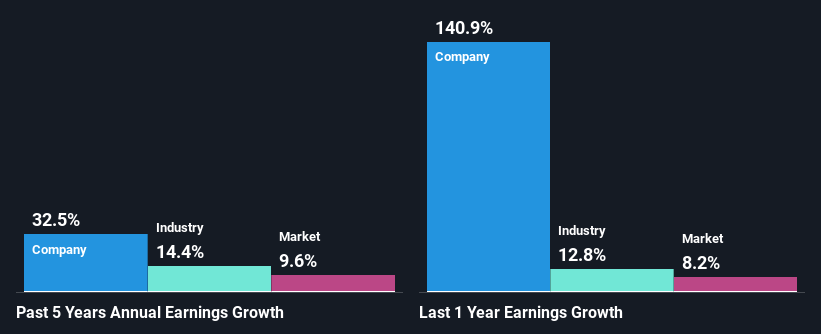
Firstly, we acknowledge that SB Technology has a significantly high ROE. Secondly, even when compared to the industry average of 14% the company's ROE is quite impressive. So, the substantial 33% net income growth seen by SB Technology over the past five years isn't overly surprising.
As a next step, we compared SB Technology's net income growth with the industry, and pleasingly, we found that the growth seen by the company is higher than the average industry growth of 14%.
Earnings growth is a huge factor in stock valuation. The investor should try to establish if the expected growth or decline in earnings, whichever the case may be, is priced in. Doing so will help them establish if the stock's future looks promising or ominous. If you're wondering about SB Technology's's valuation, check out this gauge of its price-to-earnings ratio, as compared to its industry.
Is SB Technology Using Its Retained Earnings Effectively?
SB Technology has a three-year median payout ratio of 31% (where it is retaining 69% of its income) which is not too low or not too high. By the looks of it, the dividend is well covered and SB Technology is reinvesting its profits efficiently as evidenced by its exceptional growth which we discussed above.
Besides, SB Technology has been paying dividends for at least ten years or more. This shows that the company is committed to sharing profits with its shareholders.
Conclusion
In total, we are pretty happy with SB Technology's performance. Particularly, we like that the company is reinvesting heavily into its business, and at a high rate of return. Unsurprisingly, this has led to an impressive earnings growth. Having said that, on studying current analyst estimates, we were concerned to see that while the company has grown its earnings in the past, analysts expect its earnings to shrink in the future. To know more about the company's future earnings growth forecasts take a look at this free report on analyst forecasts for the company to find out more.
Valuation is complex, but we're helping make it simple.
Find out whether SB Technology is potentially over or undervalued by checking out our comprehensive analysis, which includes fair value estimates, risks and warnings, dividends, insider transactions and financial health.
View the Free AnalysisHave feedback on this article? Concerned about the content? Get in touch with us directly. Alternatively, email editorial-team (at) simplywallst.com.
This article by Simply Wall St is general in nature. We provide commentary based on historical data and analyst forecasts only using an unbiased methodology and our articles are not intended to be financial advice. It does not constitute a recommendation to buy or sell any stock, and does not take account of your objectives, or your financial situation. We aim to bring you long-term focused analysis driven by fundamental data. Note that our analysis may not factor in the latest price-sensitive company announcements or qualitative material. Simply Wall St has no position in any stocks mentioned.
About TSE:4726
Solid track record with excellent balance sheet and pays a dividend.
