Stock Analysis
A Look At The Fair Value Of Oracle Corporation Japan (TSE:4716)


Key Insights
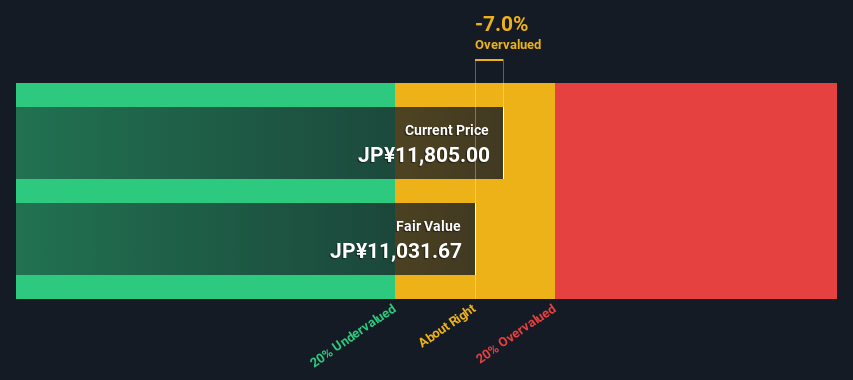
- Oracle Corporation Japan's estimated fair value is JP¥11,032 based on 2 Stage Free Cash Flow to Equity
- Oracle Corporation Japan's JP¥11,805 share price indicates it is trading at similar levels as its fair value estimate
- The JP¥11,500 analyst price target for 4716 is 4.2% more than our estimate of fair value
Does the March share price for Oracle Corporation Japan (TSE:4716) reflect what it's really worth? Today, we will estimate the stock's intrinsic value by taking the forecast future cash flows of the company and discounting them back to today's value. We will use the Discounted Cash Flow (DCF) model on this occasion. Before you think you won't be able to understand it, just read on! It's actually much less complex than you'd imagine.
Remember though, that there are many ways to estimate a company's value, and a DCF is just one method. If you want to learn more about discounted cash flow, the rationale behind this calculation can be read in detail in the Simply Wall St analysis model.
Check out our latest analysis for Oracle Corporation Japan
Step By Step Through The Calculation
We're using the 2-stage growth model, which simply means we take in account two stages of company's growth. In the initial period the company may have a higher growth rate and the second stage is usually assumed to have a stable growth rate. In the first stage we need to estimate the cash flows to the business over the next ten years. Where possible we use analyst estimates, but when these aren't available we extrapolate the previous free cash flow (FCF) from the last estimate or reported value. We assume companies with shrinking free cash flow will slow their rate of shrinkage, and that companies with growing free cash flow will see their growth rate slow, over this period. We do this to reflect that growth tends to slow more in the early years than it does in later years.
Generally we assume that a dollar today is more valuable than a dollar in the future, and so the sum of these future cash flows is then discounted to today's value:
10-year free cash flow (FCF) estimate
| 2024 | 2025 | 2026 | 2027 | 2028 | 2029 | 2030 | 2031 | 2032 | 2033 | |
| Levered FCF (¥, Millions) | JP¥66.7b | JP¥72.0b | JP¥78.7b | JP¥79.6b | JP¥80.3b | JP¥80.8b | JP¥81.2b | JP¥81.5b | JP¥81.8b | JP¥82.0b |
| Growth Rate Estimate Source | Analyst x1 | Analyst x1 | Analyst x1 | Est @ 1.13% | Est @ 0.84% | Est @ 0.63% | Est @ 0.49% | Est @ 0.39% | Est @ 0.32% | Est @ 0.27% |
| Present Value (¥, Millions) Discounted @ 5.8% | JP¥63.0k | JP¥64.4k | JP¥66.5k | JP¥63.6k | JP¥60.6k | JP¥57.7k | JP¥54.8k | JP¥52.0k | JP¥49.4k | JP¥46.8k |
("Est" = FCF growth rate estimated by Simply Wall St)
Present Value of 10-year Cash Flow (PVCF) = JP¥579b
The second stage is also known as Terminal Value, this is the business's cash flow after the first stage. For a number of reasons a very conservative growth rate is used that cannot exceed that of a country's GDP growth. In this case we have used the 5-year average of the 10-year government bond yield (0.2%) to estimate future growth. In the same way as with the 10-year 'growth' period, we discount future cash flows to today's value, using a cost of equity of 5.8%.
Terminal Value (TV)= FCF2033 × (1 + g) ÷ (r – g) = JP¥82b× (1 + 0.2%) ÷ (5.8%– 0.2%) = JP¥1.5t
Present Value of Terminal Value (PVTV)= TV / (1 + r)10= JP¥1.5t÷ ( 1 + 5.8%)10= JP¥836b
The total value, or equity value, is then the sum of the present value of the future cash flows, which in this case is JP¥1.4t. To get the intrinsic value per share, we divide this by the total number of shares outstanding. Compared to the current share price of JP¥12k, the company appears around fair value at the time of writing. Remember though, that this is just an approximate valuation, and like any complex formula - garbage in, garbage out.
The Assumptions
The calculation above is very dependent on two assumptions. The first is the discount rate and the other is the cash flows. Part of investing is coming up with your own evaluation of a company's future performance, so try the calculation yourself and check your own assumptions. The DCF also does not consider the possible cyclicality of an industry, or a company's future capital requirements, so it does not give a full picture of a company's potential performance. Given that we are looking at Oracle Corporation Japan as potential shareholders, the cost of equity is used as the discount rate, rather than the cost of capital (or weighted average cost of capital, WACC) which accounts for debt. In this calculation we've used 5.8%, which is based on a levered beta of 0.996. Beta is a measure of a stock's volatility, compared to the market as a whole. We get our beta from the industry average beta of globally comparable companies, with an imposed limit between 0.8 and 2.0, which is a reasonable range for a stable business.
SWOT Analysis for Oracle Corporation Japan
- Earnings growth over the past year exceeded its 5-year average.
- Currently debt free.
- Earnings growth over the past year underperformed the Software industry.
- Dividend is low compared to the top 25% of dividend payers in the Software market.
- Annual revenue is forecast to grow faster than the Japanese market.
- Good value based on P/E ratio compared to estimated Fair P/E ratio.
- Annual earnings are forecast to grow slower than the Japanese market.
Looking Ahead:
Whilst important, the DCF calculation is only one of many factors that you need to assess for a company. DCF models are not the be-all and end-all of investment valuation. Rather it should be seen as a guide to "what assumptions need to be true for this stock to be under/overvalued?" If a company grows at a different rate, or if its cost of equity or risk free rate changes sharply, the output can look very different. For Oracle Corporation Japan, there are three further aspects you should further examine:
- Financial Health: Does 4716 have a healthy balance sheet? Take a look at our free balance sheet analysis with six simple checks on key factors like leverage and risk.
- Future Earnings: How does 4716's growth rate compare to its peers and the wider market? Dig deeper into the analyst consensus number for the upcoming years by interacting with our free analyst growth expectation chart.
- Other Solid Businesses: Low debt, high returns on equity and good past performance are fundamental to a strong business. Why not explore our interactive list of stocks with solid business fundamentals to see if there are other companies you may not have considered!
PS. The Simply Wall St app conducts a discounted cash flow valuation for every stock on the TSE every day. If you want to find the calculation for other stocks just search here.
Valuation is complex, but we're helping make it simple.
Find out whether Oracle Corporation Japan is potentially over or undervalued by checking out our comprehensive analysis, which includes fair value estimates, risks and warnings, dividends, insider transactions and financial health.
View the Free AnalysisHave feedback on this article? Concerned about the content? Get in touch with us directly. Alternatively, email editorial-team (at) simplywallst.com.
This article by Simply Wall St is general in nature. We provide commentary based on historical data and analyst forecasts only using an unbiased methodology and our articles are not intended to be financial advice. It does not constitute a recommendation to buy or sell any stock, and does not take account of your objectives, or your financial situation. We aim to bring you long-term focused analysis driven by fundamental data. Note that our analysis may not factor in the latest price-sensitive company announcements or qualitative material. Simply Wall St has no position in any stocks mentioned.
About TSE:4716
Oracle Corporation Japan
Oracle Corporation Japan engages in the development and sale of software and hardware products and solutions in Japan.
Excellent balance sheet with proven track record.
