Stock Analysis
Has Generation Pass Co.,Ltd.'s (TSE:3195) Impressive Stock Performance Got Anything to Do With Its Fundamentals?


Generation PassLtd's (TSE:3195) stock is up by a considerable 19% over the past three months. Given that stock prices are usually aligned with a company's financial performance in the long-term, we decided to study its financial indicators more closely to see if they had a hand to play in the recent price move. Particularly, we will be paying attention to Generation PassLtd's ROE today.
Return on equity or ROE is an important factor to be considered by a shareholder because it tells them how effectively their capital is being reinvested. In other words, it is a profitability ratio which measures the rate of return on the capital provided by the company's shareholders.
View our latest analysis for Generation PassLtd
How Is ROE Calculated?
ROE can be calculated by using the formula:
Return on Equity = Net Profit (from continuing operations) ÷ Shareholders' Equity
So, based on the above formula, the ROE for Generation PassLtd is:
0.6% = JP¥11m ÷ JP¥1.9b (Based on the trailing twelve months to January 2024).
The 'return' refers to a company's earnings over the last year. So, this means that for every ¥1 of its shareholder's investments, the company generates a profit of ¥0.01.
What Has ROE Got To Do With Earnings Growth?
Thus far, we have learned that ROE measures how efficiently a company is generating its profits. We now need to evaluate how much profit the company reinvests or "retains" for future growth which then gives us an idea about the growth potential of the company. Assuming everything else remains unchanged, the higher the ROE and profit retention, the higher the growth rate of a company compared to companies that don't necessarily bear these characteristics.
Generation PassLtd's Earnings Growth And 0.6% ROE
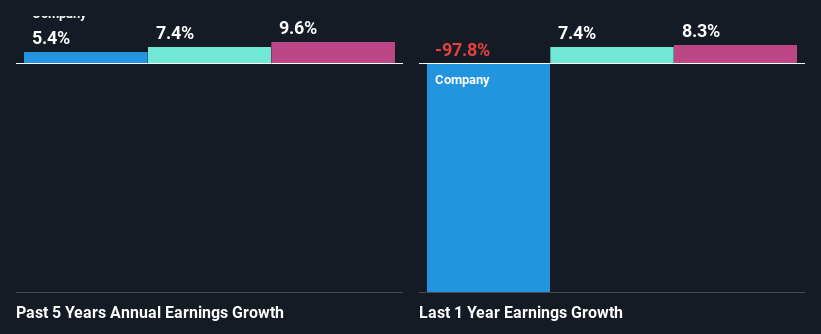
It is quite clear that Generation PassLtd's ROE is rather low. Even compared to the average industry ROE of 9.1%, the company's ROE is quite dismal. Generation PassLtd was still able to see a decent net income growth of 5.4% over the past five years. Therefore, the growth in earnings could probably have been caused by other variables. Such as - high earnings retention or an efficient management in place.
As a next step, we compared Generation PassLtd's net income growth with the industry and were disappointed to see that the company's growth is lower than the industry average growth of 7.4% in the same period.
The basis for attaching value to a company is, to a great extent, tied to its earnings growth. It’s important for an investor to know whether the market has priced in the company's expected earnings growth (or decline). By doing so, they will have an idea if the stock is headed into clear blue waters or if swampy waters await. Is Generation PassLtd fairly valued compared to other companies? These 3 valuation measures might help you decide.
Is Generation PassLtd Efficiently Re-investing Its Profits?
While the company did pay out a portion of its dividend in the past, it currently doesn't pay a regular dividend. We infer that the company has been reinvesting all of its profits to grow its business.
Summary
In total, it does look like Generation PassLtd has some positive aspects to its business. That is, a decent growth in earnings backed by a high rate of reinvestment. However, we do feel that that earnings growth could have been higher if the business were to improve on the low ROE rate. Especially given how the company is reinvesting a huge chunk of its profits. While we won't completely dismiss the company, what we would do, is try to ascertain how risky the business is to make a more informed decision around the company. To know the 3 risks we have identified for Generation PassLtd visit our risks dashboard for free.
Valuation is complex, but we're helping make it simple.
Find out whether Generation PassLtd is potentially over or undervalued by checking out our comprehensive analysis, which includes fair value estimates, risks and warnings, dividends, insider transactions and financial health.
View the Free AnalysisHave feedback on this article? Concerned about the content? Get in touch with us directly. Alternatively, email editorial-team (at) simplywallst.com.
This article by Simply Wall St is general in nature. We provide commentary based on historical data and analyst forecasts only using an unbiased methodology and our articles are not intended to be financial advice. It does not constitute a recommendation to buy or sell any stock, and does not take account of your objectives, or your financial situation. We aim to bring you long-term focused analysis driven by fundamental data. Note that our analysis may not factor in the latest price-sensitive company announcements or qualitative material. Simply Wall St has no position in any stocks mentioned.
About TSE:3195
Generation PassLtd
Generation Pass Co.,Ltd. offers e-commerce marketing and support services in Japan.
Adequate balance sheet and slightly overvalued.
