Stock Analysis
Are Robust Financials Driving The Recent Rally In Tsuburaya Fields Holdings Inc.'s (TSE:2767) Stock?


Tsuburaya Fields Holdings' (TSE:2767) stock is up by a considerable 8.8% over the past week. Since the market usually pay for a company’s long-term fundamentals, we decided to study the company’s key performance indicators to see if they could be influencing the market. Particularly, we will be paying attention to Tsuburaya Fields Holdings' ROE today.
Return on equity or ROE is an important factor to be considered by a shareholder because it tells them how effectively their capital is being reinvested. In simpler terms, it measures the profitability of a company in relation to shareholder's equity.
See our latest analysis for Tsuburaya Fields Holdings
How Is ROE Calculated?
The formula for return on equity is:
Return on Equity = Net Profit (from continuing operations) ÷ Shareholders' Equity
So, based on the above formula, the ROE for Tsuburaya Fields Holdings is:
27% = JP¥13b ÷ JP¥49b (Based on the trailing twelve months to December 2023).
The 'return' is the yearly profit. So, this means that for every ¥1 of its shareholder's investments, the company generates a profit of ¥0.27.
What Is The Relationship Between ROE And Earnings Growth?
So far, we've learned that ROE is a measure of a company's profitability. We now need to evaluate how much profit the company reinvests or "retains" for future growth which then gives us an idea about the growth potential of the company. Generally speaking, other things being equal, firms with a high return on equity and profit retention, have a higher growth rate than firms that don’t share these attributes.
A Side By Side comparison of Tsuburaya Fields Holdings' Earnings Growth And 27% ROE
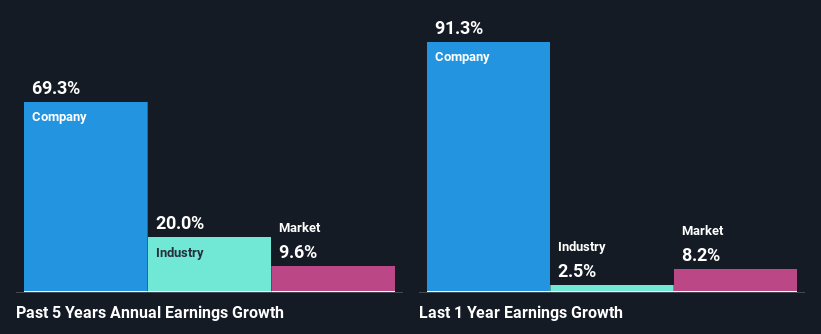
First thing first, we like that Tsuburaya Fields Holdings has an impressive ROE. Second, a comparison with the average ROE reported by the industry of 11% also doesn't go unnoticed by us. Under the circumstances, Tsuburaya Fields Holdings' considerable five year net income growth of 69% was to be expected.
As a next step, we compared Tsuburaya Fields Holdings' net income growth with the industry, and pleasingly, we found that the growth seen by the company is higher than the average industry growth of 20%.
The basis for attaching value to a company is, to a great extent, tied to its earnings growth. What investors need to determine next is if the expected earnings growth, or the lack of it, is already built into the share price. This then helps them determine if the stock is placed for a bright or bleak future. If you're wondering about Tsuburaya Fields Holdings''s valuation, check out this gauge of its price-to-earnings ratio, as compared to its industry.
Is Tsuburaya Fields Holdings Efficiently Re-investing Its Profits?
Tsuburaya Fields Holdings has a really low three-year median payout ratio of 20%, meaning that it has the remaining 80% left over to reinvest into its business. This suggests that the management is reinvesting most of the profits to grow the business as evidenced by the growth seen by the company.
Besides, Tsuburaya Fields Holdings has been paying dividends for at least ten years or more. This shows that the company is committed to sharing profits with its shareholders.
Conclusion
In total, we are pretty happy with Tsuburaya Fields Holdings' performance. In particular, it's great to see that the company is investing heavily into its business and along with a high rate of return, that has resulted in a sizeable growth in its earnings. Having said that, the company's earnings growth is expected to slow down, as forecasted in the current analyst estimates. To know more about the latest analysts predictions for the company, check out this visualization of analyst forecasts for the company.
Valuation is complex, but we're helping make it simple.
Find out whether Tsuburaya Fields Holdings is potentially over or undervalued by checking out our comprehensive analysis, which includes fair value estimates, risks and warnings, dividends, insider transactions and financial health.
View the Free AnalysisHave feedback on this article? Concerned about the content? Get in touch with us directly. Alternatively, email editorial-team (at) simplywallst.com.
This article by Simply Wall St is general in nature. We provide commentary based on historical data and analyst forecasts only using an unbiased methodology and our articles are not intended to be financial advice. It does not constitute a recommendation to buy or sell any stock, and does not take account of your objectives, or your financial situation. We aim to bring you long-term focused analysis driven by fundamental data. Note that our analysis may not factor in the latest price-sensitive company announcements or qualitative material. Simply Wall St has no position in any stocks mentioned.
About TSE:2767
Tsuburaya Fields Holdings
Tsuburaya Fields Holdings Inc. engages in the content-related businesses in Japan.
Outstanding track record with flawless balance sheet and pays a dividend.
